Hello there,
I have two images (29.09.2017 (image A)) and (16.10.2017(image B)).
My goal is two compare some forest areas. (before and after a storm).
After calculating the NDVI via SNAP (optical>thermatic landprocessing>vegetation radiometric indices>NDVI Processor).
I receive strange results it turns out the NDVI is higher after the storm then before.
I did one preprocessing step atmospheric corection with Sen2Cor (third party Plugin).
Is any other preprocessing step necessary to receive comparable data?
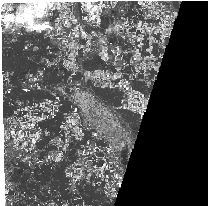
For image A i have a black corner in the lower right corner (see picture bellow). I saw that for many Sentinel 2 images on the open HUB. Does this affect the pixel values or any other parameter of the image data.