Dear all,
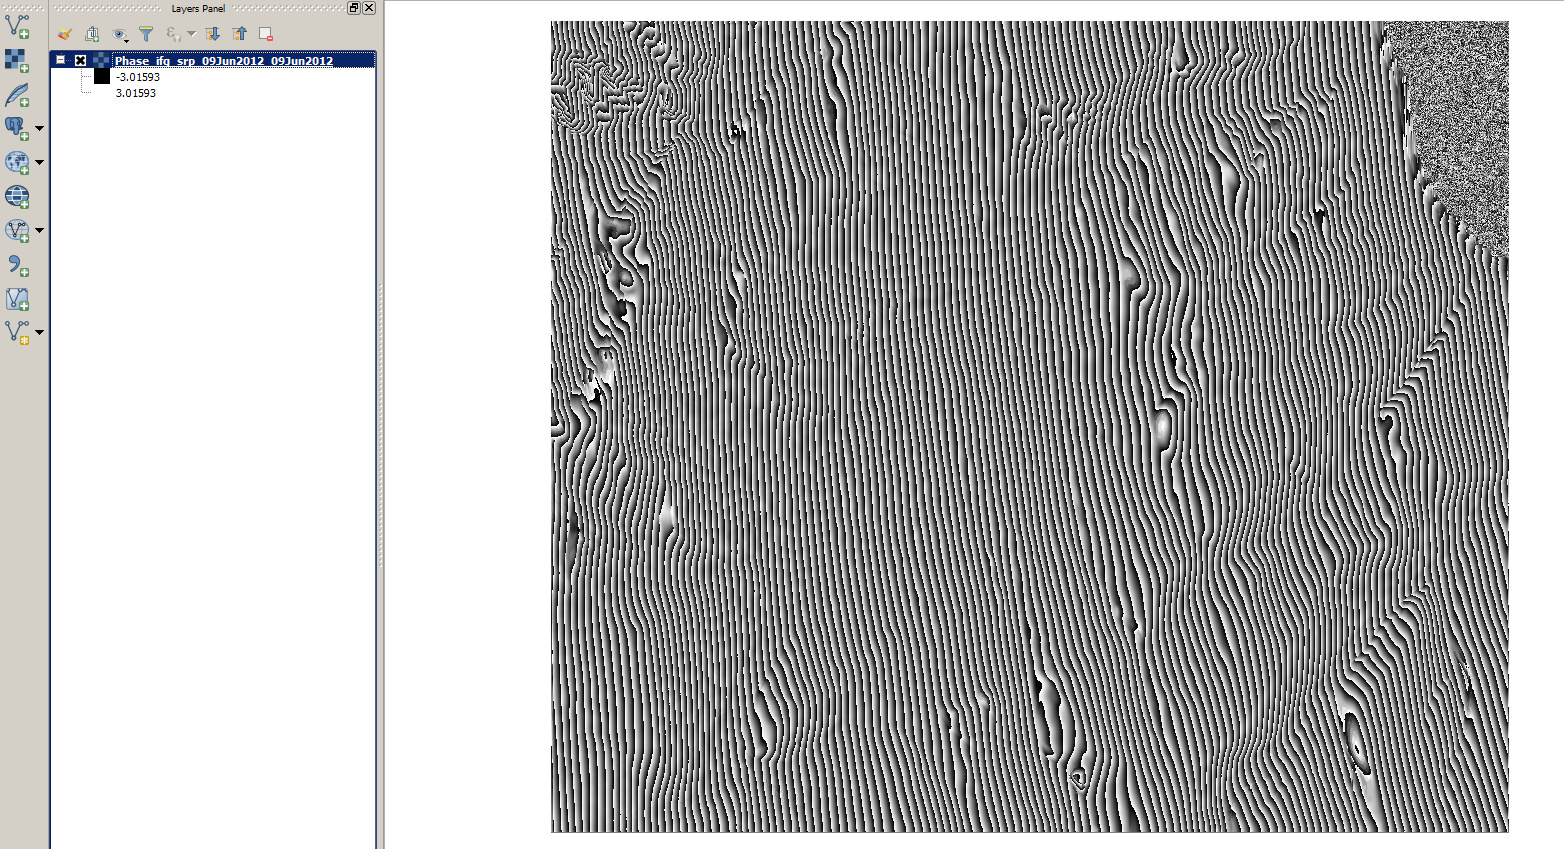
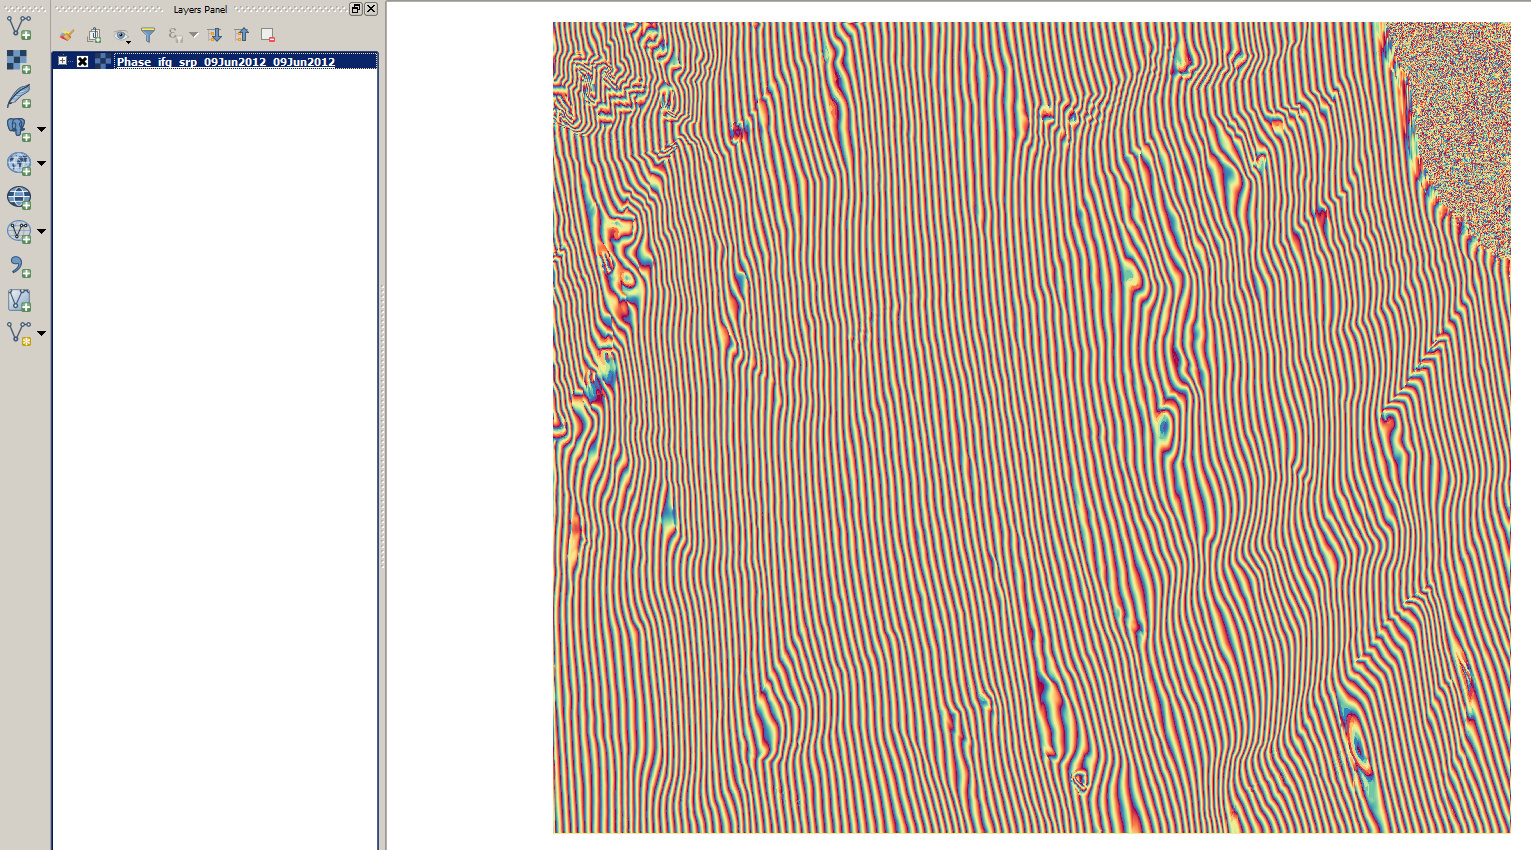
I got very beautiful and colorful fringes from SNAP but when I want to export that image in tif format, fringes are not colorful  .
.
Do you have any idea for solving this problem?
Cheers,
Marjan
1 Like
The GeoTiff format doesn’t store any color information.
You only see the colorful fringes in SNAP as the color scale is attached to interferograms.
If you are working with GeoTiffs in SNAP you can change the colors in the color manipulation tab. Outside SNAP you’ll have to adjust the colors according to your GIS software.
There are ways to store colors in GeoTiffs but this depends on the software you’re using.
http://www.gdal.org/frmt_gtiff.html
Thanks. I am using QGIS but I did not see any option for changing colors.
You can do this under layer properties > style > singleband pseudocolor
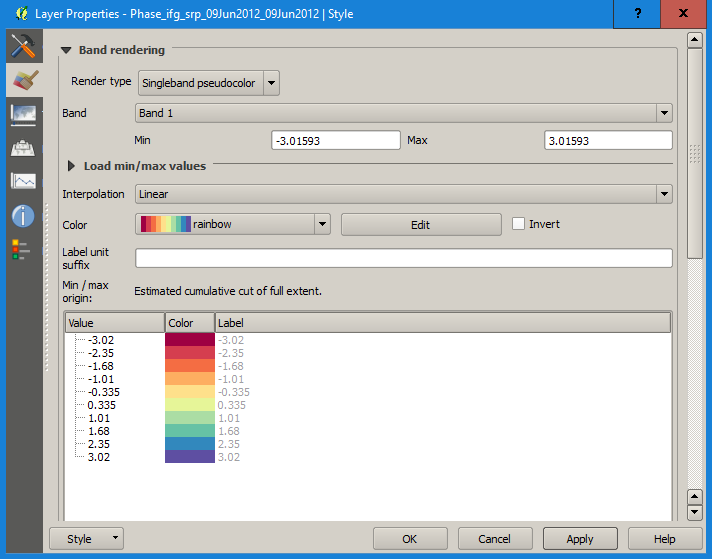
You can also create new colour ramps (color brewer for example)
Thank you so much my friend and one more question. I tried to bring coordinate information on my image (Look at figure example)
but I could not do it in QGIS. Would you please guide me in this case?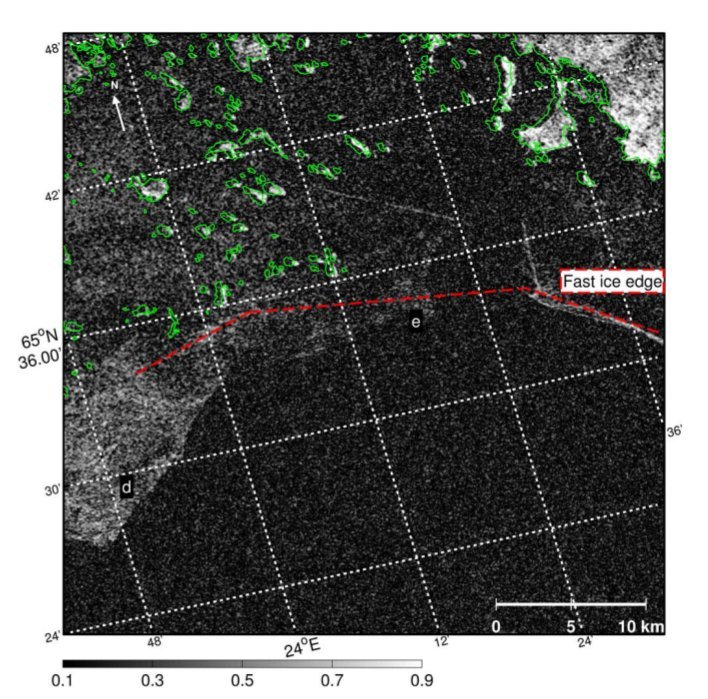
View > Decorations > Grid > Enable Grid
Thanks my friend:relaxed:
My location gedalinfo is like below:
Corner Coordinates:
Upper Left ( 641122.860, 7308535.034) ( 24d 5’39.20"E, 65d52’ 0.25"N)
Lower Left ( 641122.860, 7231955.034) ( 24d 0’50.04"E, 65d10’50.25"N)
Upper Right ( 721802.860, 7308535.034) ( 25d51’24.61"E, 65d49’15.39"N)
Lower Right ( 721802.860, 7231955.034) ( 25d43’51.97"E, 65d 8’10.51"N)
Center ( 681462.860, 7270245.034) ( 24d55’26.75"E, 65d30’13.14"N)
When I am using grid in QGIS, then I have coordinates on image but it shows by ( 641122.860, 7308535.034) style but I want to show coordinate by ( 24d 5’39.20"E, 65d52’ 0.25"N) style. I could not find any place for changing it.
Do you know is it possible to change them to E and N coordinates in QGIS or not?
Cheers,
Marjan

the raster is projected and displayed in UTM coordinates.
If you want to display it in Geographic Coordinates (Latitude and Logitude) you need to change the projection of the project in the lower right corner to WGS84 (EPSG4326)
![]()
Thanks. It works but I want to have these coordinates on my image, when I open ‘new print composer’ but I can not see these coordinates there on my image. I do not know why?
if you are in the print composer you have to enable the grid separately
there you can also select the coordinate system

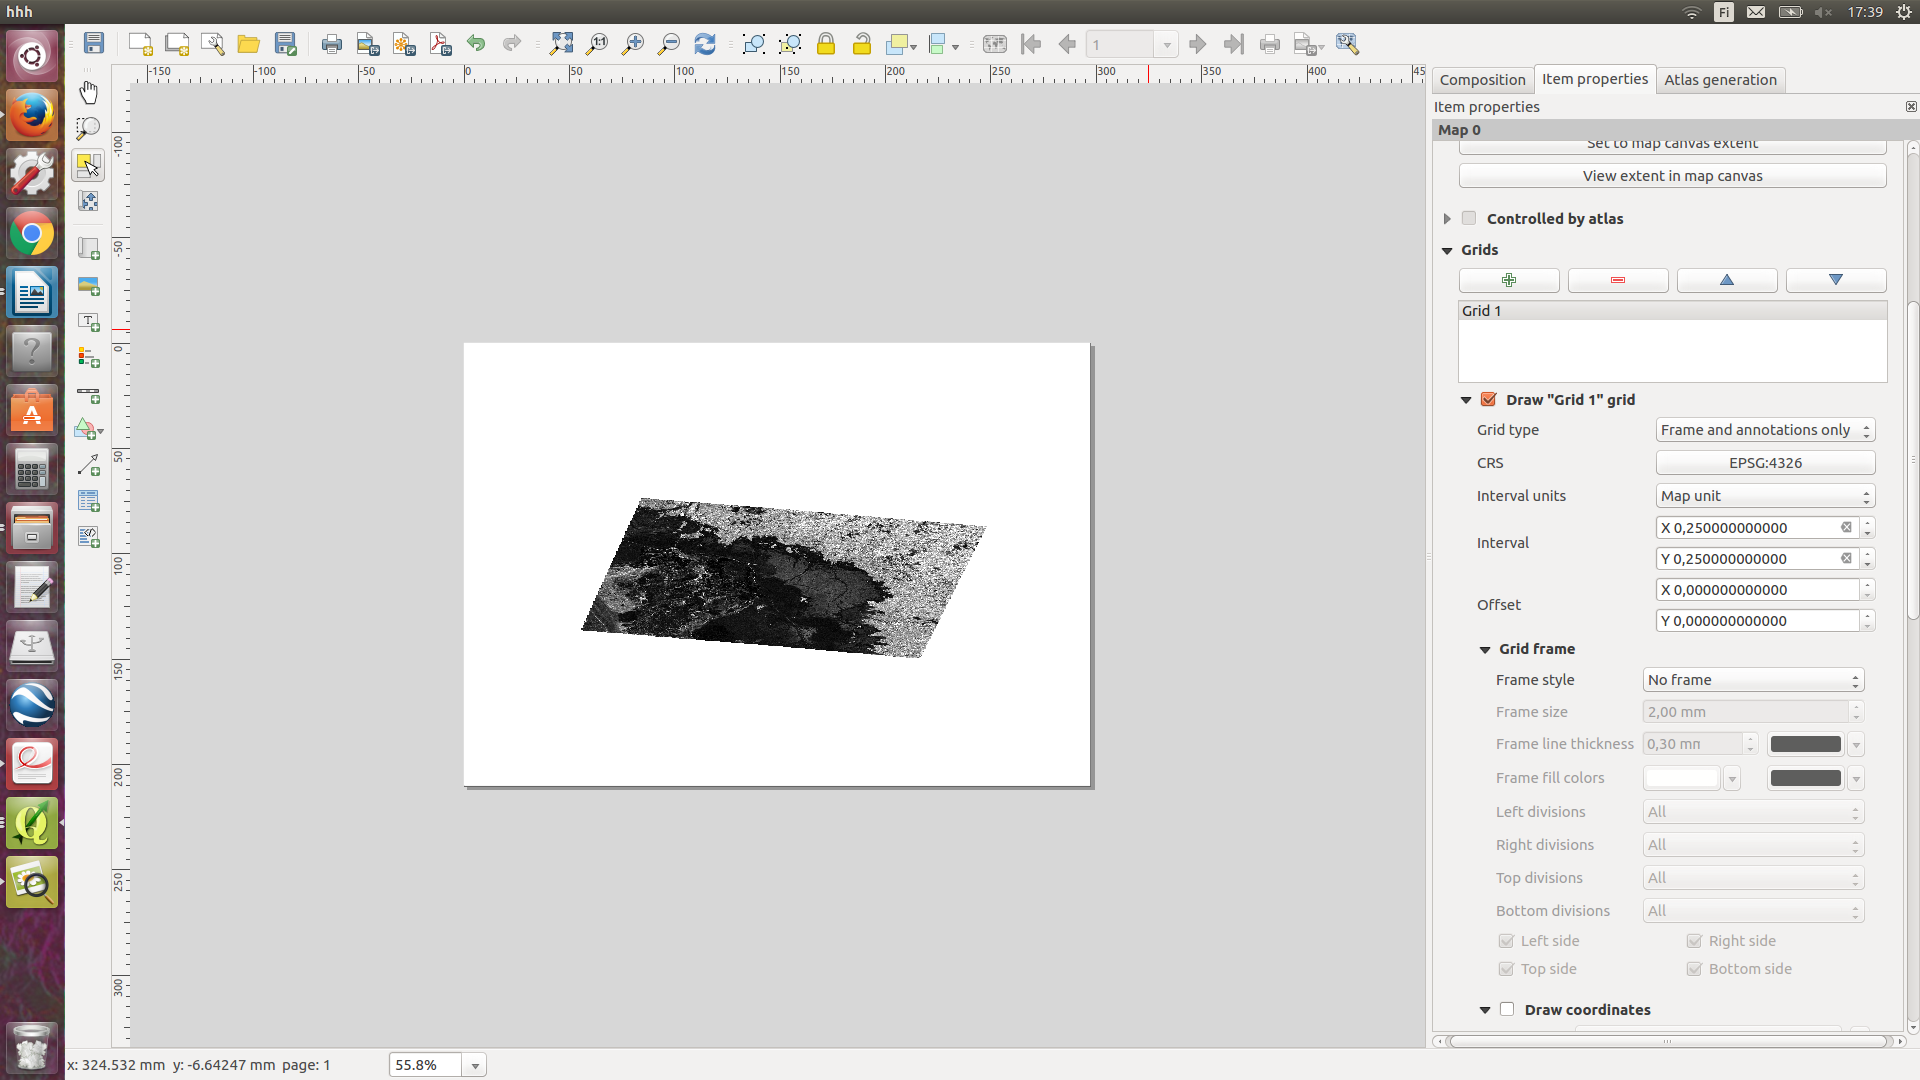
Change the options grid type and frame style accordingly
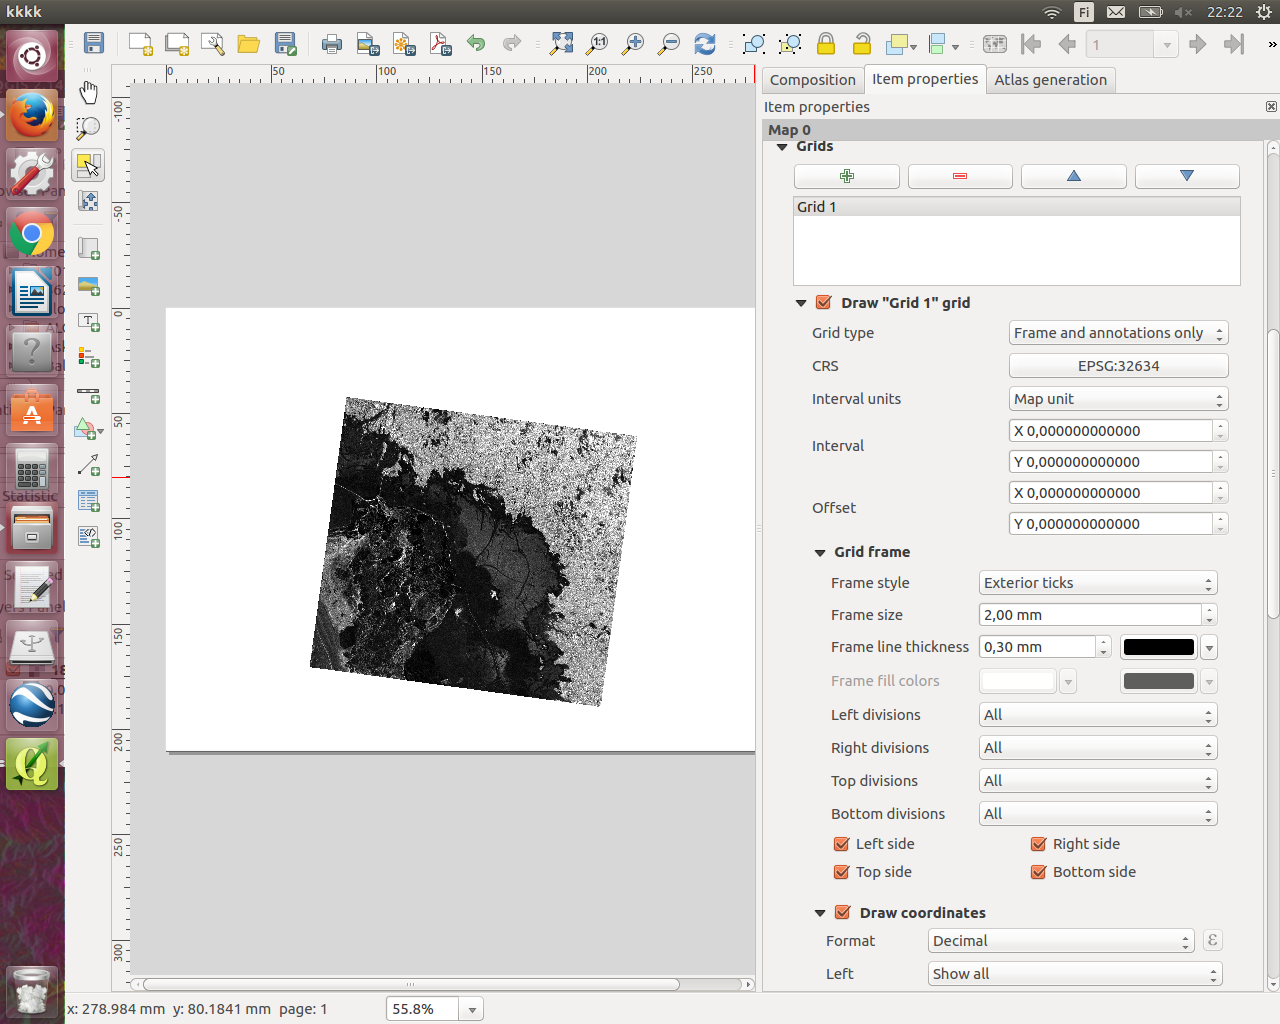
OHHH…I found it…Thanks:slight_smile:
My friend, I have one more question about this colorful part. When I use those options for having colorful fringe, then I will have a red background for that. If you look at image in below you can find it in ‘‘Thumbnail’’ part. Do you have any idea for removing this red background?
Thanks
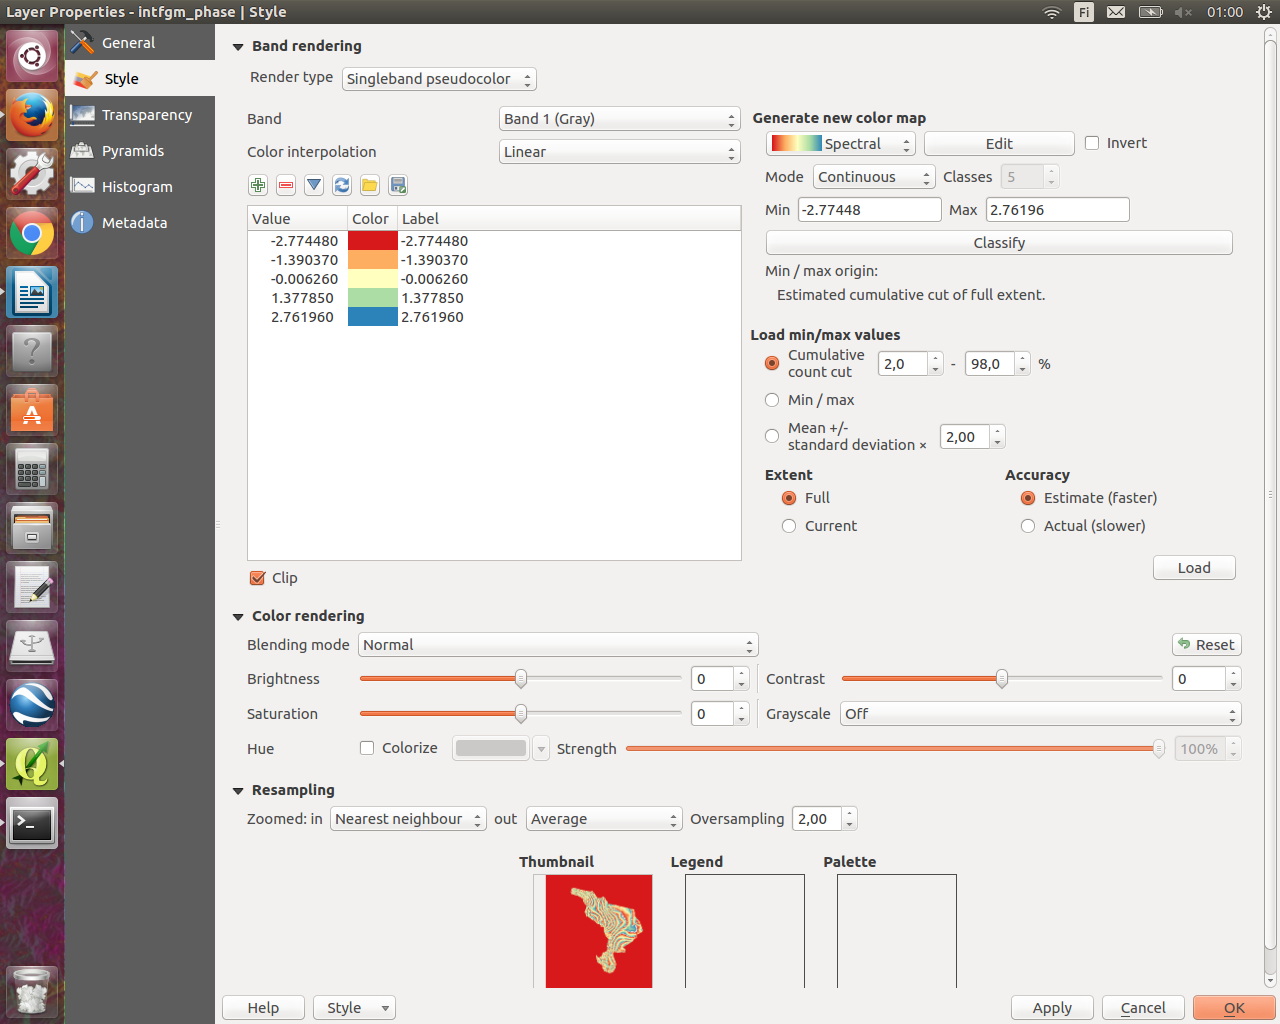
You can define a transparent value in the Transparency menu. Identify the raster value in the red area and enter it in “additional no data value”
Thanks. We have in SNAP, scale bar that we can see it in left corner. Please look at bellow image.

But I can not find it in QGIS. I can only see some number without colourful bar.

I s there like this option in QGIS too?
only the one in the legend I guess.
I played with it but it does not work.