If you set the Mode to Equal Interval and the Number of Classes higher (e.g. 10) you can have at least this. But a continuous legend is not possible in QGIS, as far as I know.

Yes, you are right. I think there is not any way for that but anyway thank you so much for great guiding.
Hi
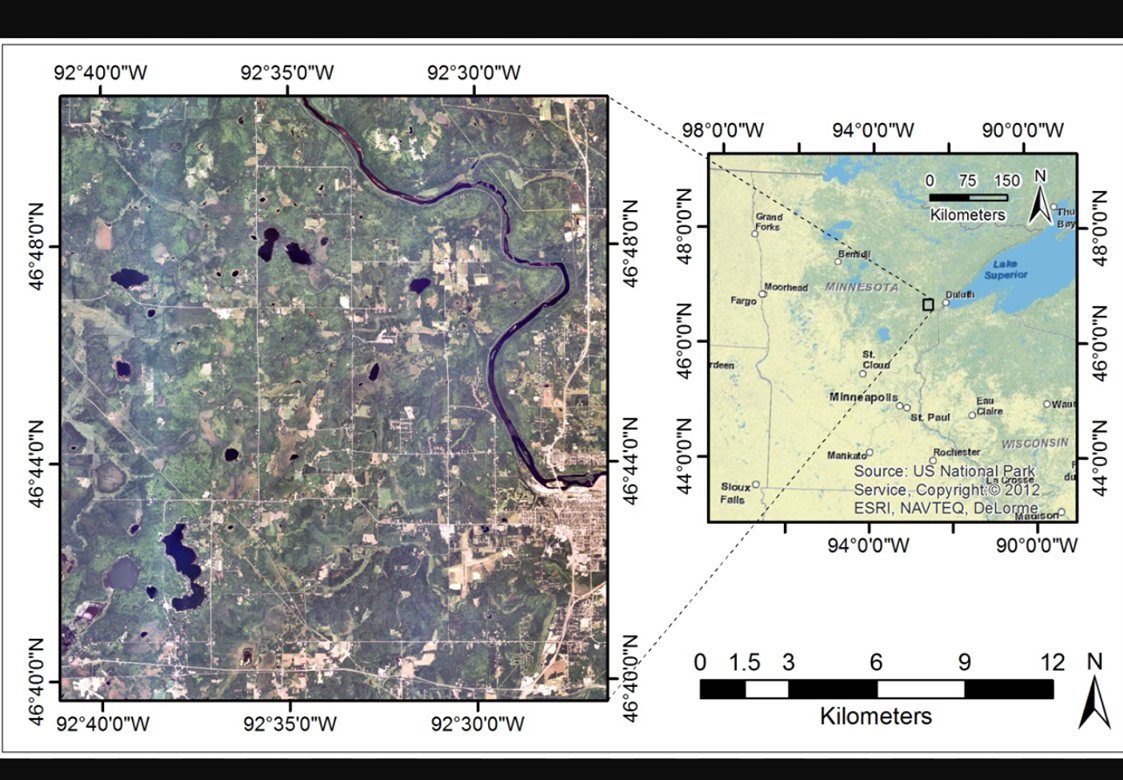
- I added coordinates for Baltic sea. I use ‘WGS84/ EPSG:4326’Look at below,
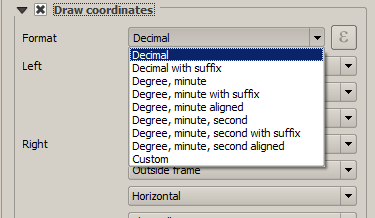
But I want to see them with ‘E, W,N, S’ symbols like below image. Can you hep me in this part?
- I put north direction here but I do not know this is real north side or I should change direction by rotation?

these are advanced styling options which can only be chosen in the print composer
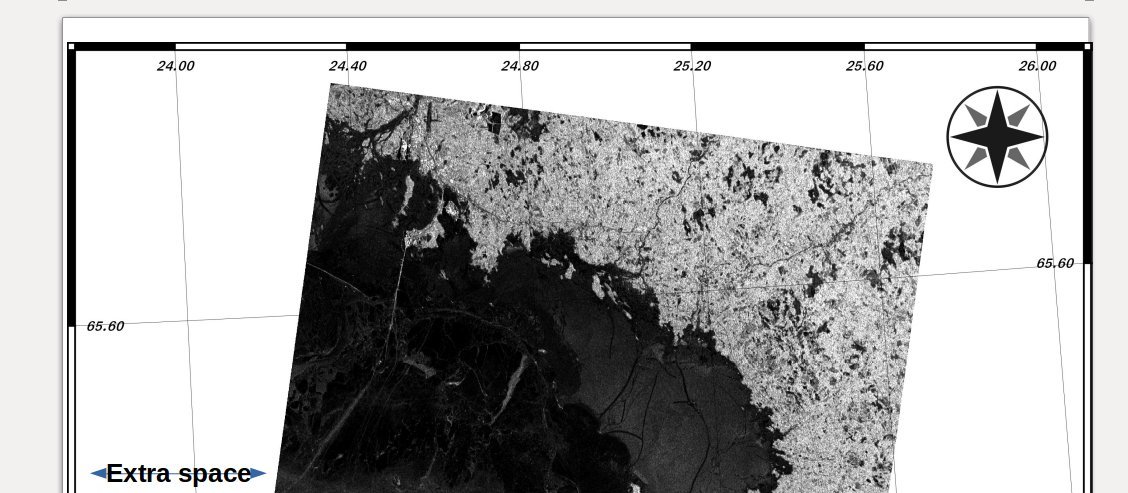
Yes. Thanks. One thing more. I added one image in QGIS but it is rotated and when I put it in Print composer, there are some extra space in it. I played with X and Y axes but still I have this extra space.
Would you please guide me how can I delete this extra space?
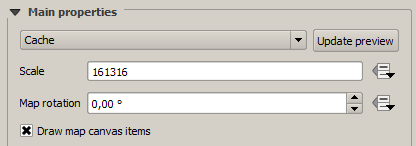
select this icon and move by dragging your cursor or zoom with scrolling wheel
![]()
Or change the scale accordingly.
Or resize your framw with this icon
![]()
Thanks:slight_smile:
Dear friend,
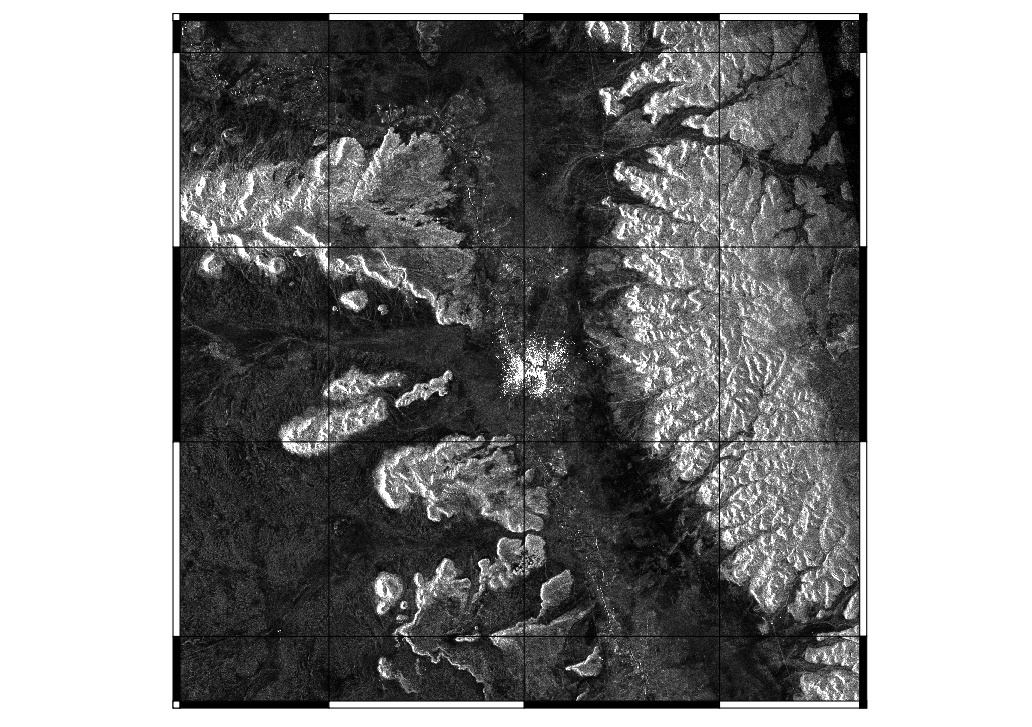
I have displacement picture from SNAP and I put it on Sentinel2 image but I do not know why my displacement image has so much extra area around it. Do you have any idea for delete extra area?
You can digitize a polygon and select Raster > Extraction > Clip and use the polygon as mask
Dear friend,
As I mentioned that before, I used ‘new print composer’ in QGIS but when I am using ‘Add map’ and I added an map. I can not cut extra space. It does not related to page setting or page size. I do not know what can I do with this extra space that I can not cut it.
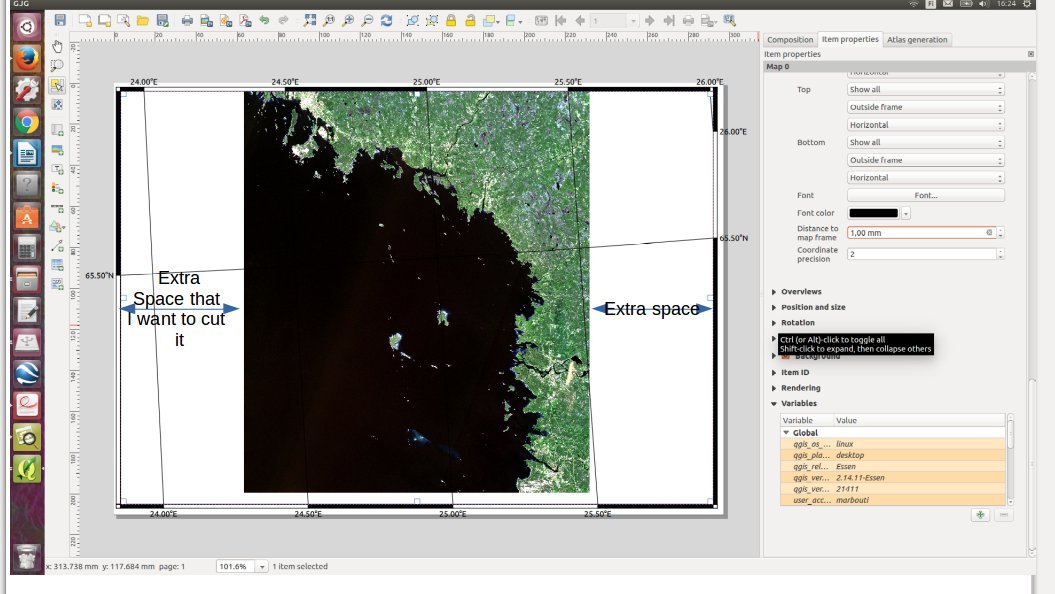
do you want the frame to be smaller or the image to be larger?
I want that the image completely fit to frame.
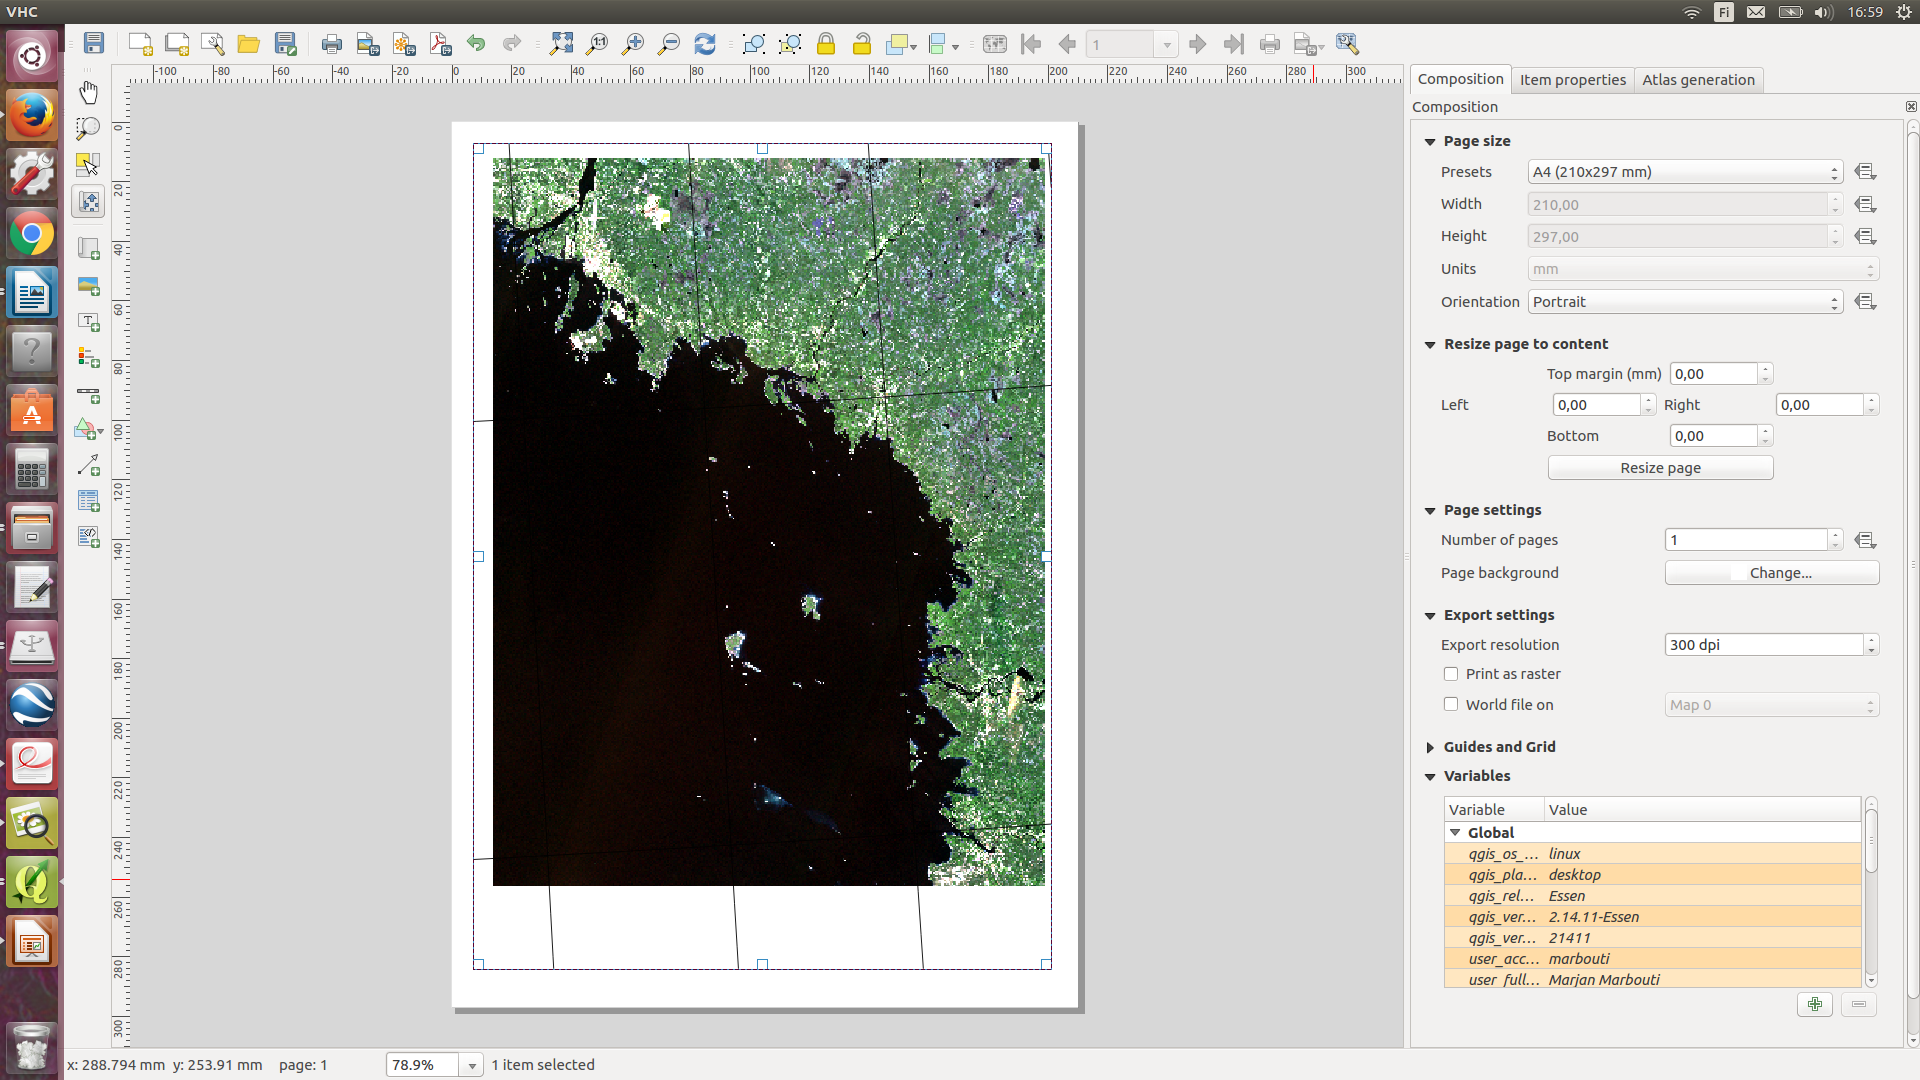
OK. I think I found a solution. I changed ‘landscape’ to ‘portrait’. It seems better now.
I f you find better solution, please let me know.
I still don’t get the problem 
You can either make the frame smaller by dragging the sides with the select-mouse or increase the scale so a smaller size of the image is shown. ‘Stretching’ the image over the frame is not possible.

Option A: Changing the size of the frame
Option B: Increasing scale
Dear friend,
It solved. Thank you so much for answering questions. Your forum is so useful.
Dear friend
I used this site for making maps http://www.qgistutorials.com/en/docs/making_a_map.html
but when I change coordinate reference system from WGS84 (EPSG:4326) to WGS84/ UTM zone 34N (EPSG: 32634), but I do not know why it does not work and I think software will be stopped here. Look at below image.
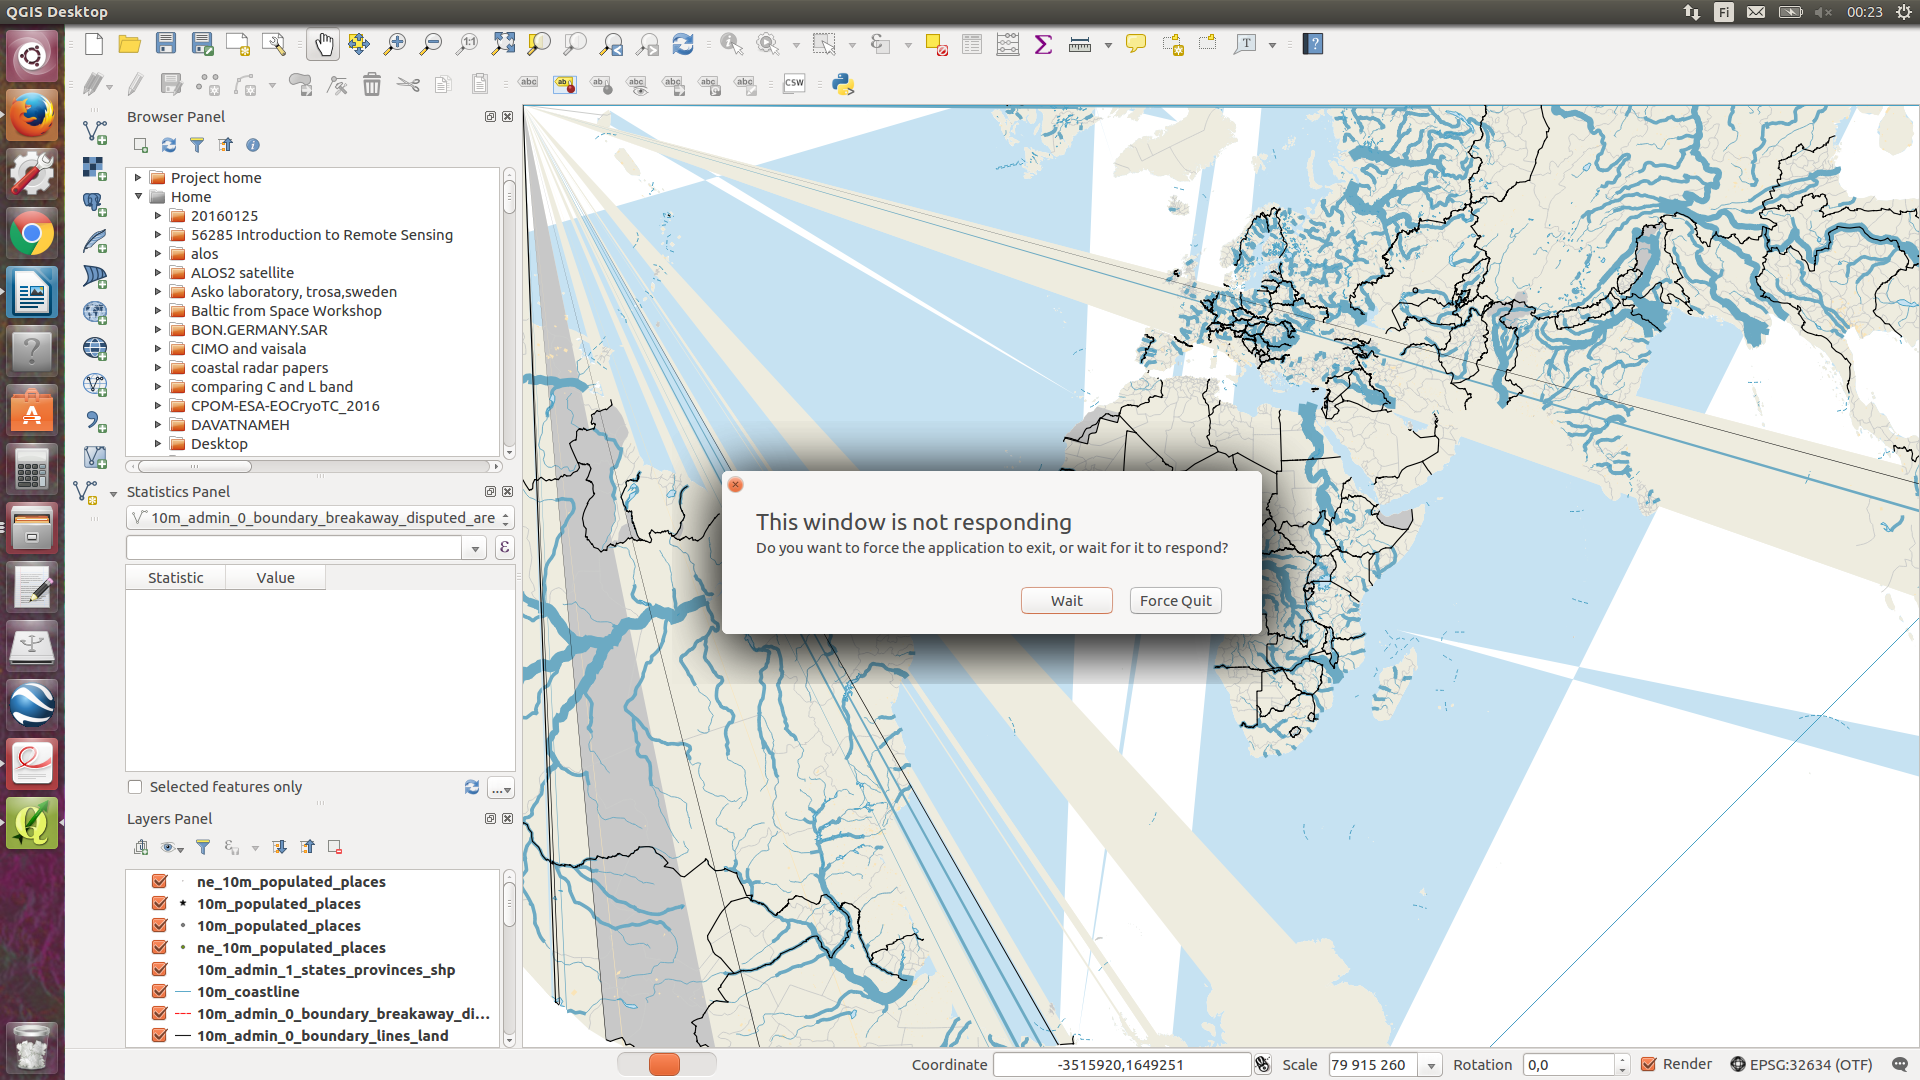
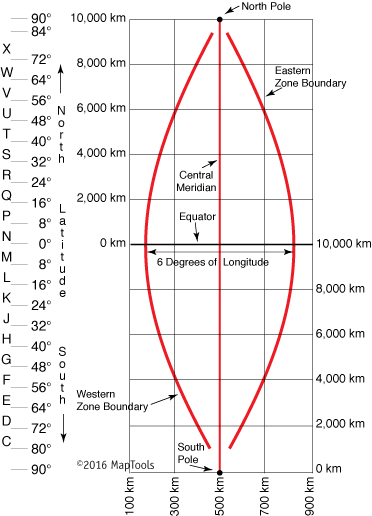
data of global coverage, such as basemaps, is mostly projected in WGS84 (EPSG:4326) and cannot be displayed in by single UTM zone correctly. As you know, UTM zones are only valid for stripes of 6 degrees. Any information outside of this is unusable. It is not uncommon that datasets are wrongly displayed when using regional projecttions.
Dear ABraun,
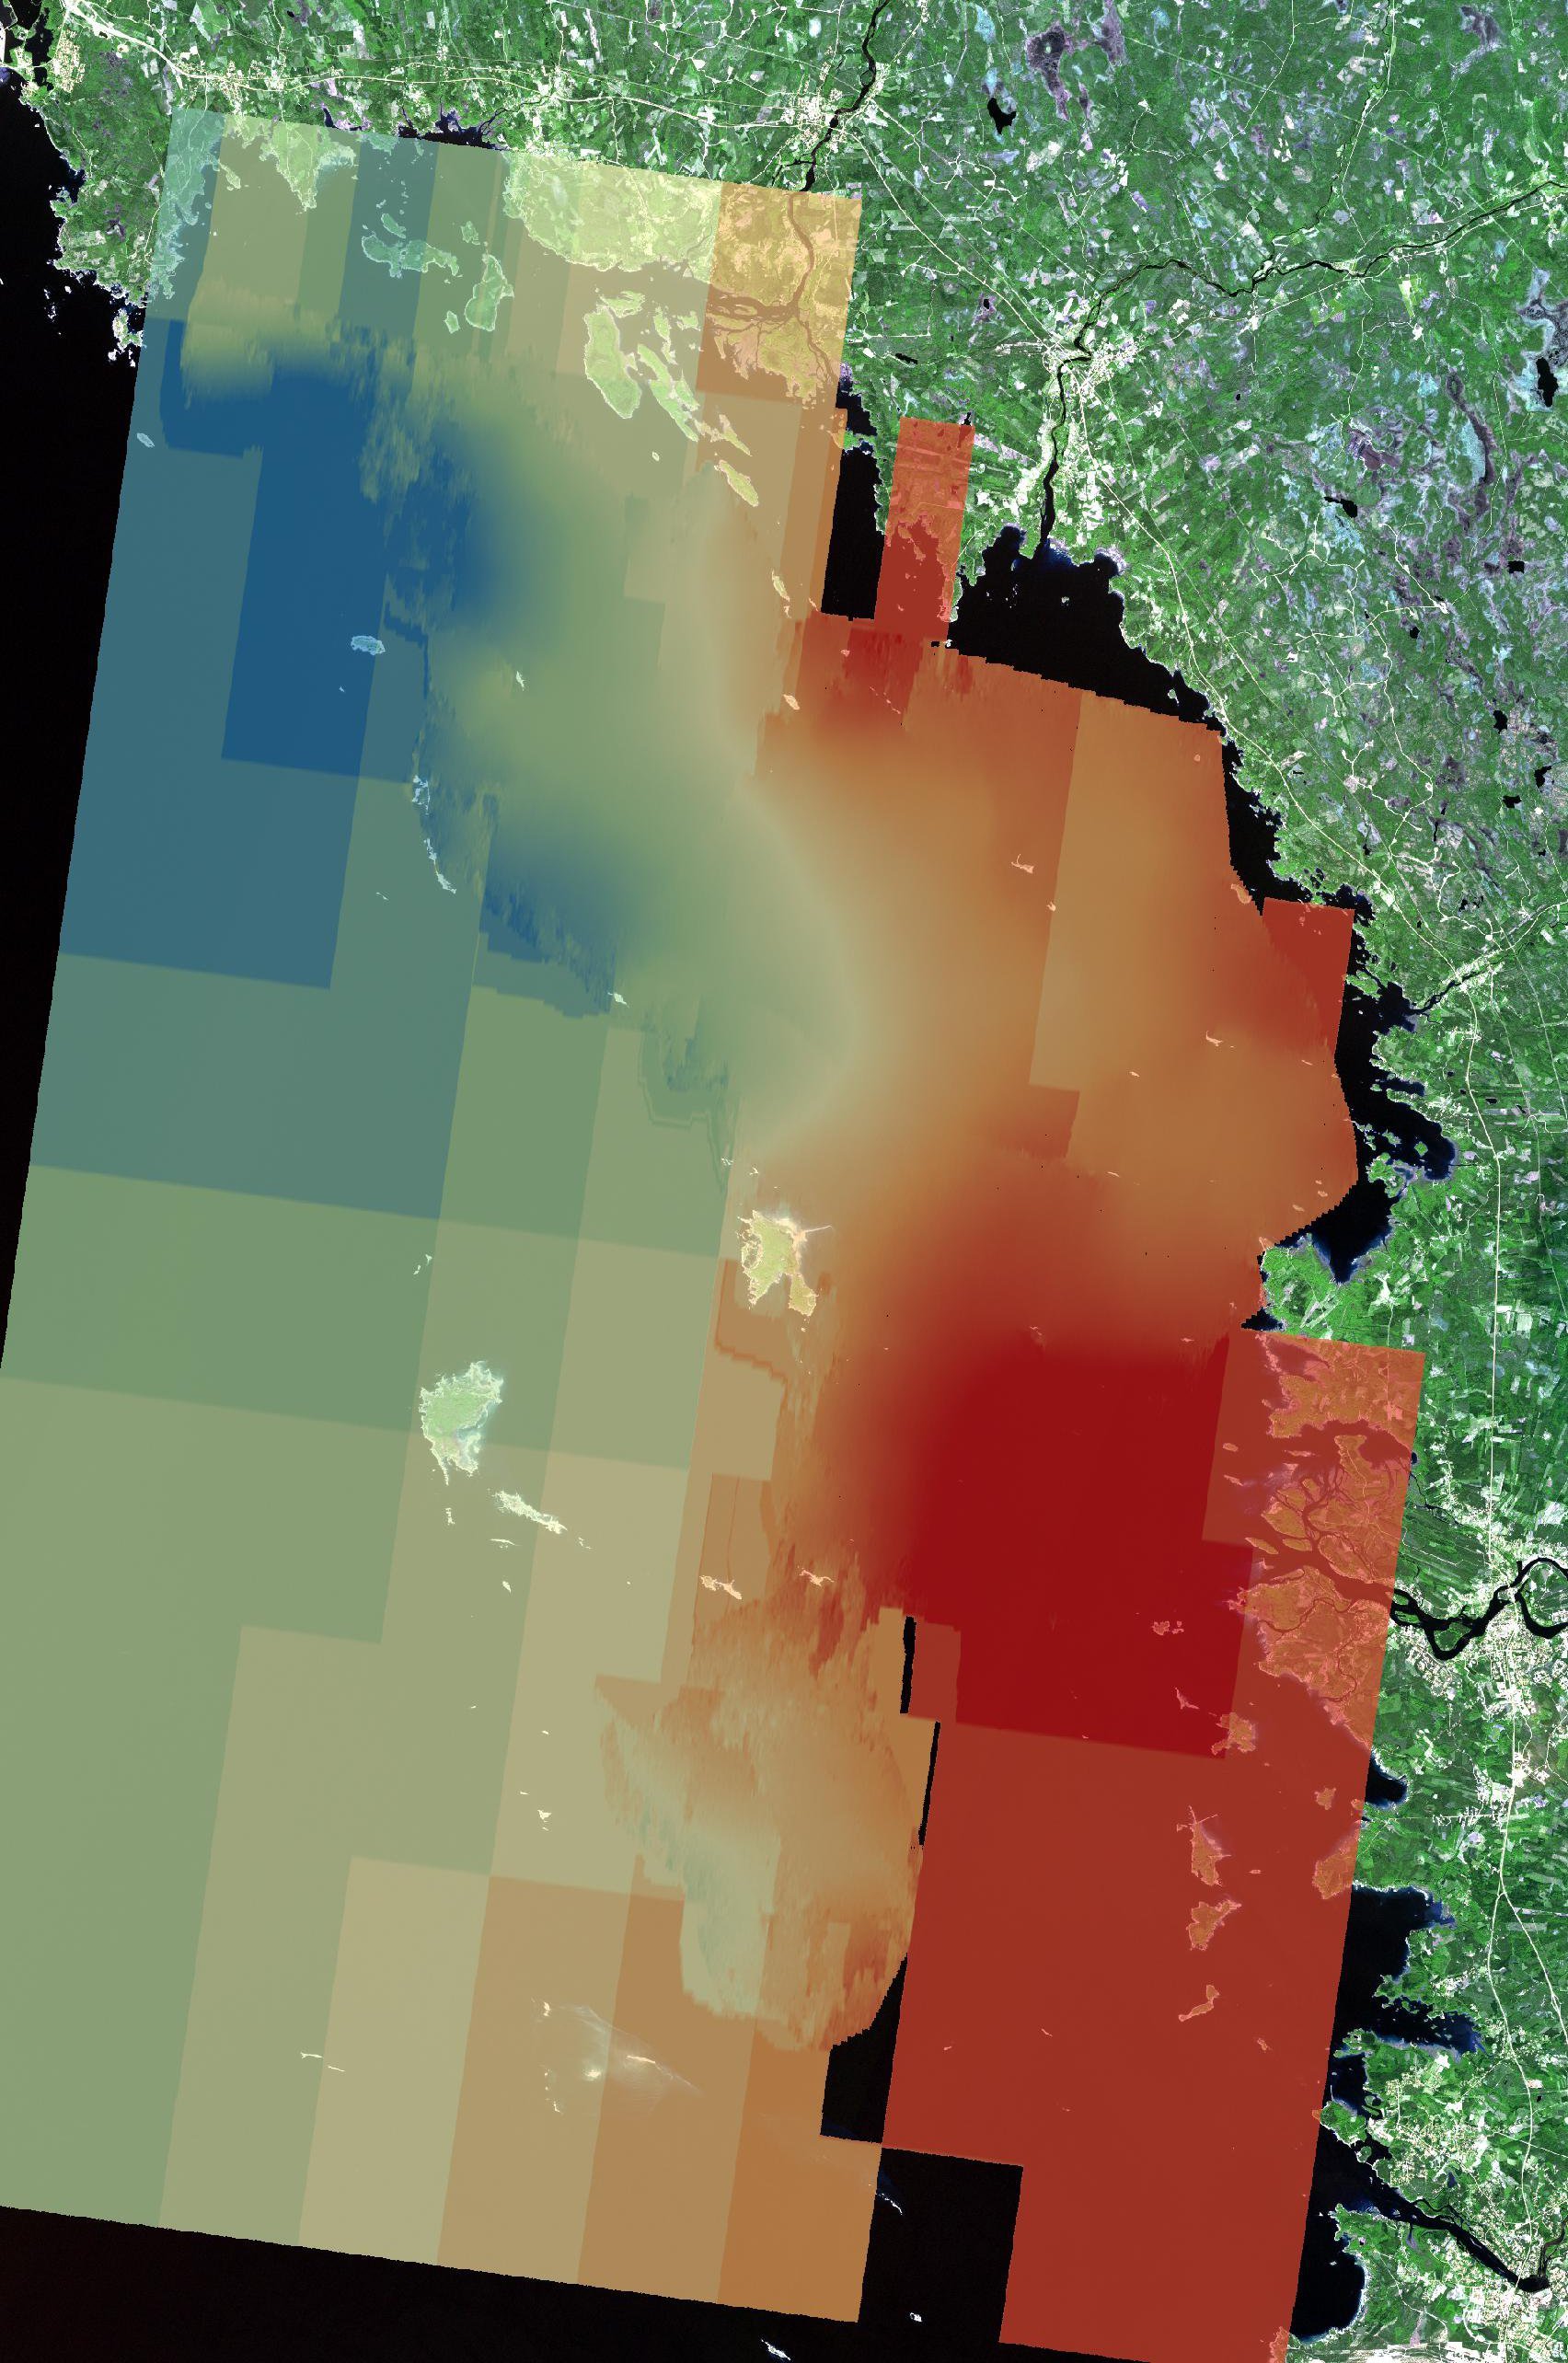
I exported CSV file (generated using stamps) into QGIS for plotting high-resolution image. I used lat, long, and velocity of the CSV file. How to add color to this image?
I added x as latitude, y as longitude, and z as velocity. If it is wrong please help me.
Layer Properties > Symbology > Graduated > Define color ramp and number of classes > Apply
1 Like
Thank you ABraun. How to import SRTM 1arc second data to my study area in QGIS?