Dear all,
Please correct me, if I am wrong?
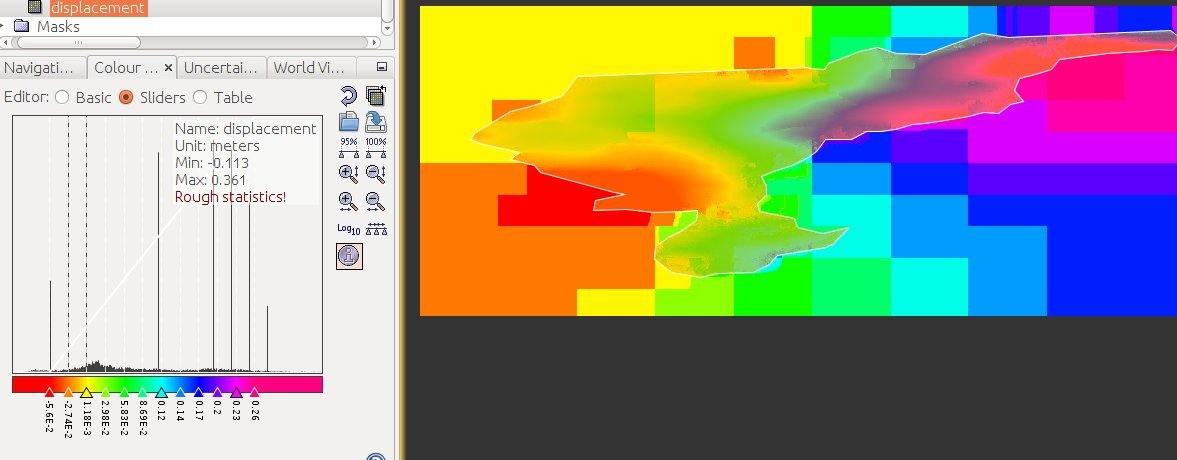
As you see in below picture, displacement is between -5cm to 26 cm.In my idea, based on
Q2-9.Why do an interferogram from ascending orbits and one from descending orbits look different? http://vldb.gsi.go.jp/sokuchi/sar/qanda/qanda-e.html#q2-8
We can tell from -5 cm to 0 cm, ice change near to satellite (it can be uplift_vertical_ or it can be horizontal displacement toward satellite).
We can tell from 0 cm to 26 cm, ice change far from satellite (it can be subsidence_vertical_ or it can be horizontal displacement go away from the satellite).
But we do not know which direction, i mean we do not know if it has negative sign, it means uplift or horizontal.
If I understood your question well, So the difference in displacement between Asce. and Desc. might be comes from the difference in the date of each pairs this is the first thing the second thing, As you know that the direction of Satellite is difference between both in Asc and Dec. path, so in case of snow monitoring might be the detected area is different and then the properties of the snow in both directions are also different.
This I explained to you before in a previous post if you remember
For more about the horizontal displacement, take a look at the landslide displacement and make change and simulation of the processing workflow.
Also take a look at this topic might be it is helpful
The displacement values are somewhat a function of the unwrapped phase I believe.
Phase in general, is a “measurement” of the returned signal burst (s), i.e. representing something like a “distance”, (consisting of real and imagery part as to make it mathematically feasible to process). Wrapped is the whole there and back “distance” unwrapped just the part affected by the actual measurement.
I wouldn’t put my hand into fire for this explanation of a radar phase, but if it helps to image it…