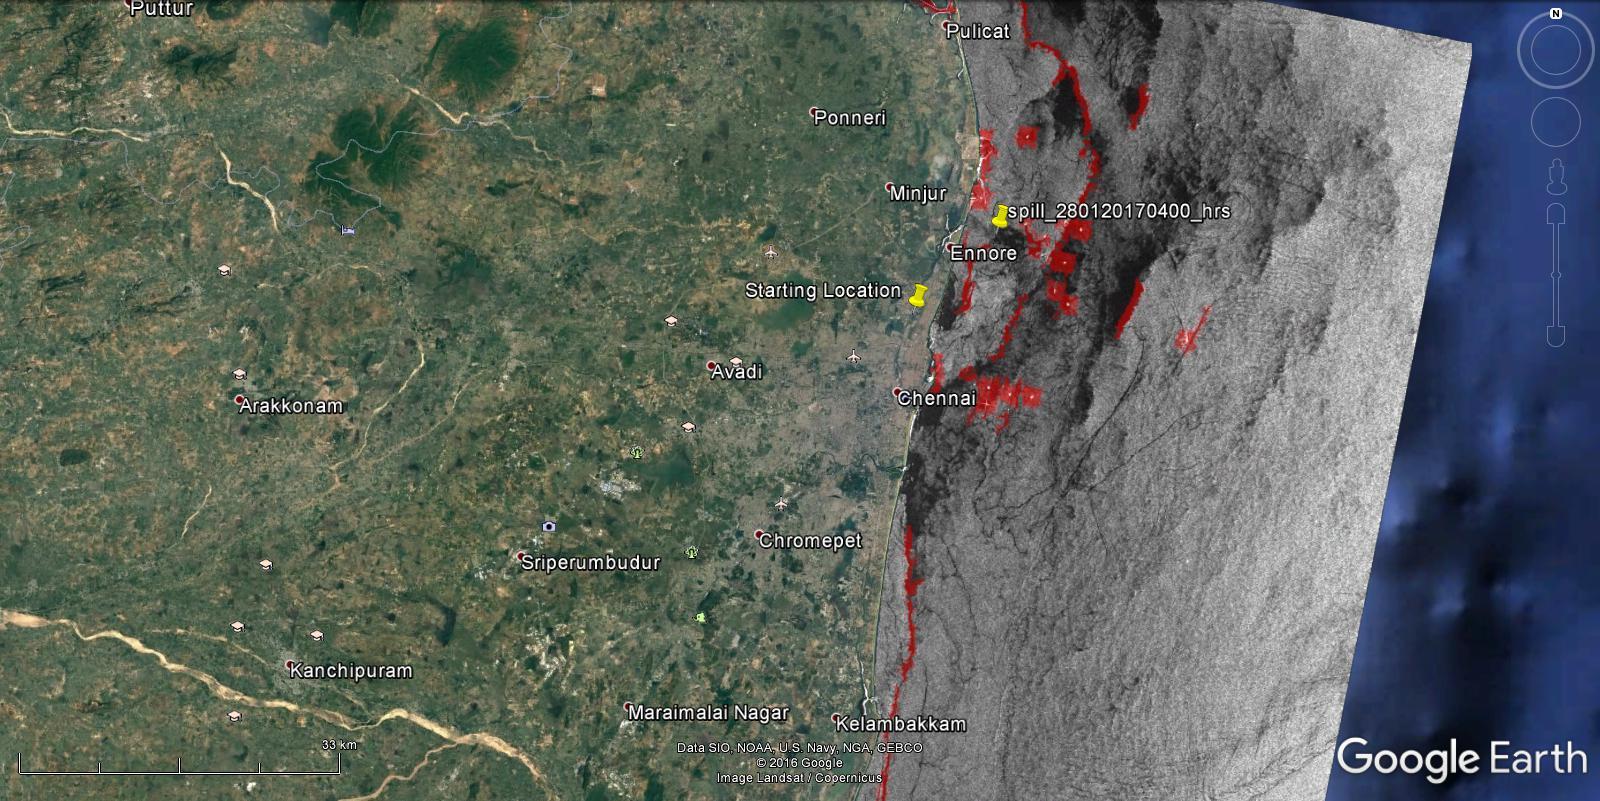
is there any other ways to cover the zone with spill bit mask?
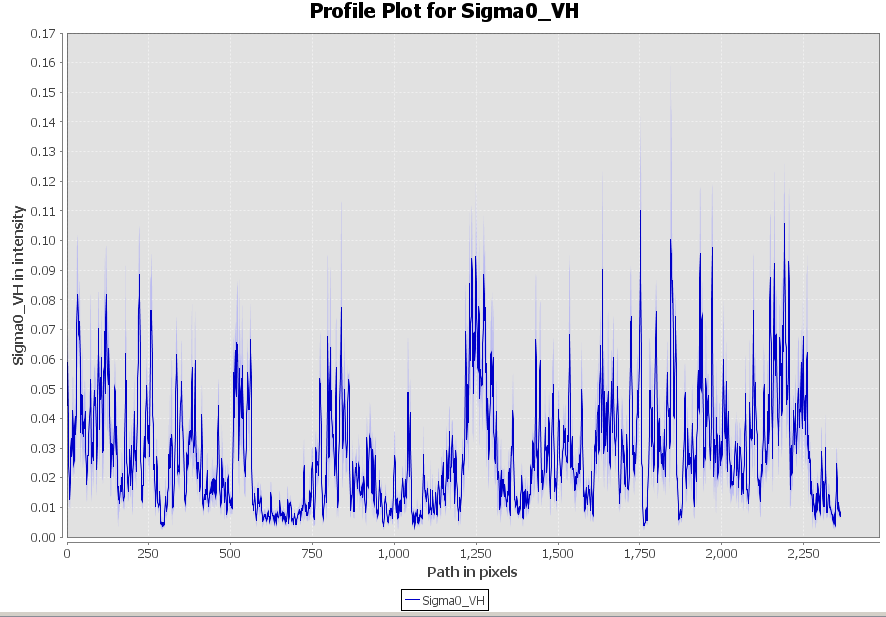
how can i extract the scatter/intensity plot for an area? i need to show the variation in the intensity of dark spots and nor- dark zones?
could you suggest me on the other feature interpretation , like wave, currents from this data ?
You can apply stronger filters which enhance the dark areas befor the masking process.
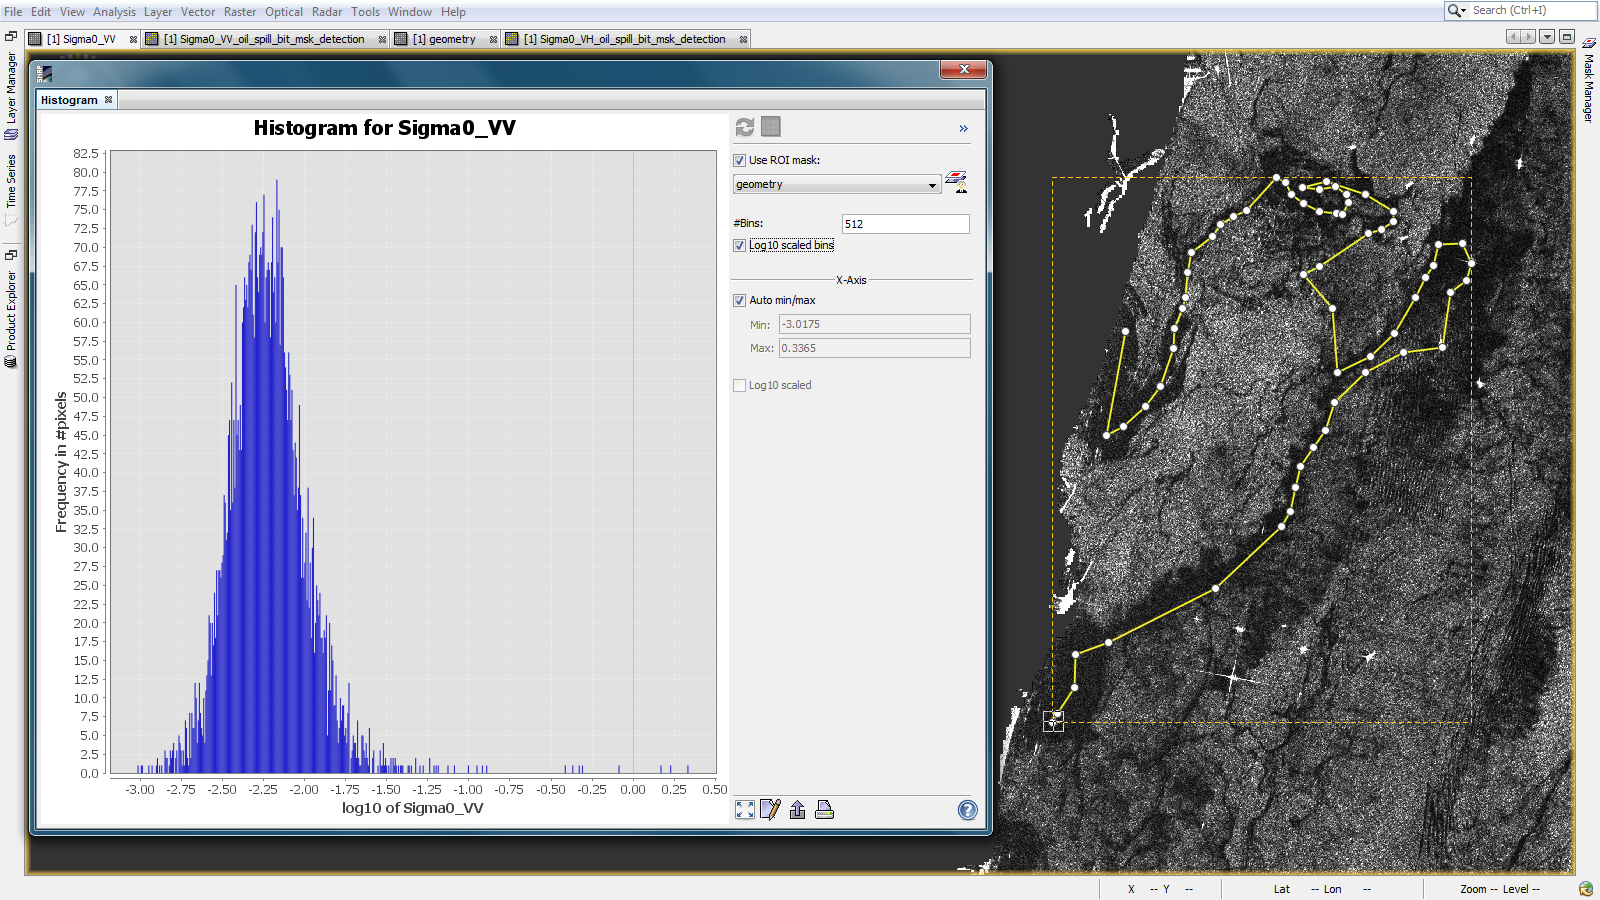
You can draw a polygon and investigate the histogram of oil and non-oil areas.
it is giving the bar chart as displayed. it gives/shows the values, when the cursor is moved.
In this profile plot,
1.How can i eliminate the shaded line? ie. the standard deviation
2. i need to draw, plot line(line graph), instead of bar chart, suggest me how i can do it ?
3.why it is considering only the masked zone, if i navigate the cursor out of the mask, it is showing NaN?
4.how can i merge, the chart with sigma band, so that , it should display the value of sigma0 on the polyline itself, i.e on the drawn polyline itself.
5. Which filters, i can apply before masking in the oil spill detection tool?
To investigate the darkness of pixels I would rather recommend a histogram instead of a profile plot.
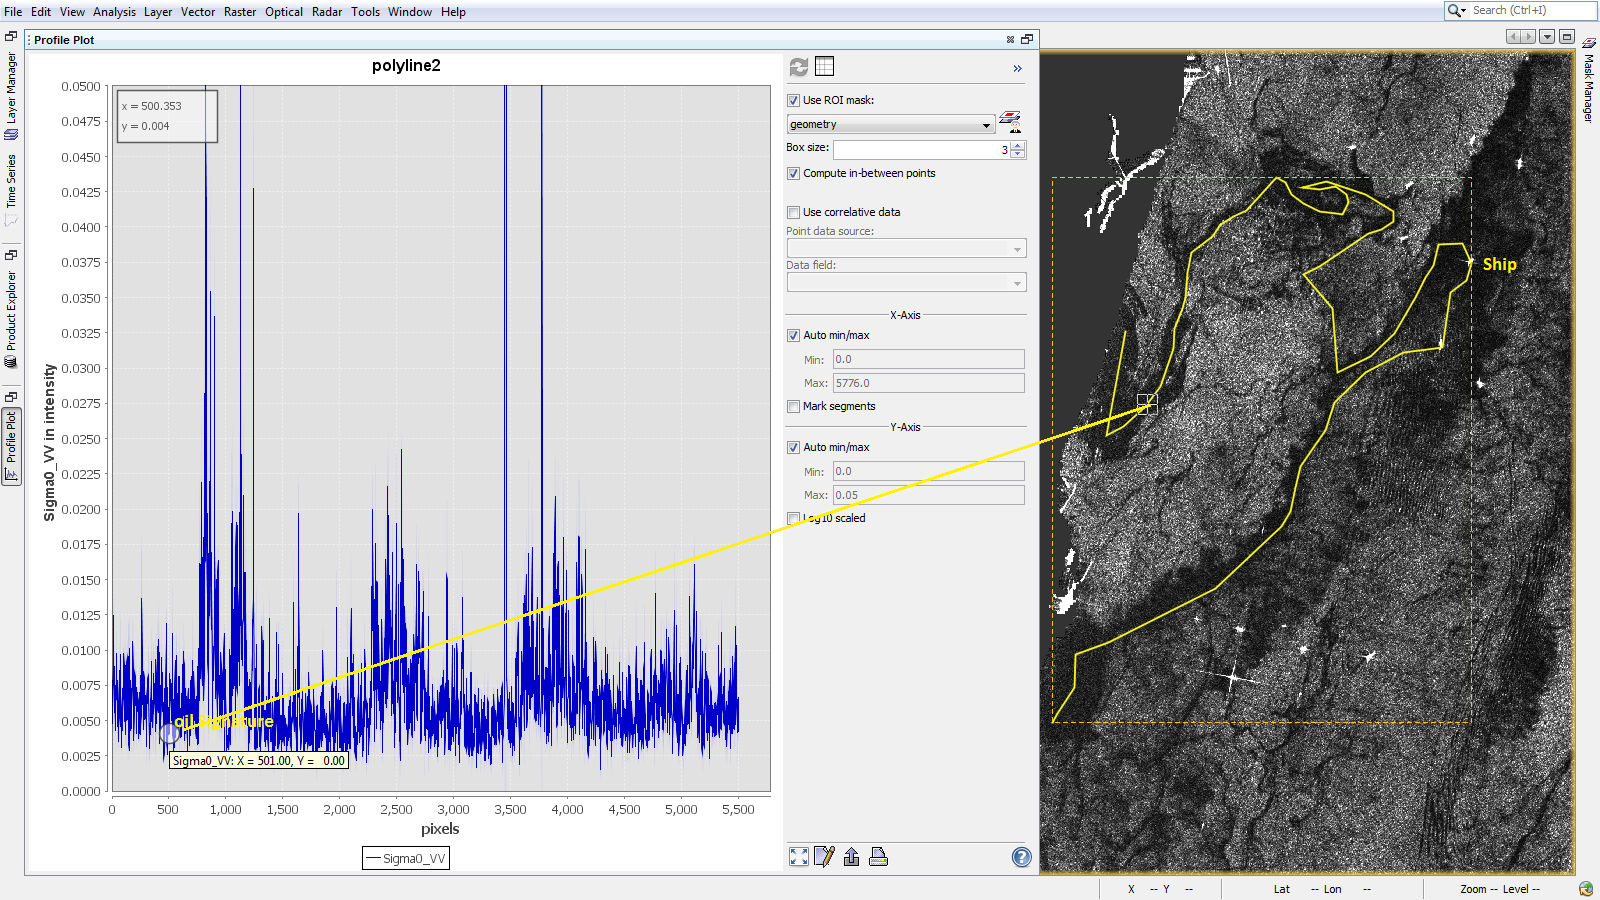
If you want to draw a plot along the line you should place the line on the image intensities instead of the _msk_detection output file. This would give you something more like this:
i could able to get some signatures. i.e the values of intensity (<=0.004). i am taking this as a threshold value.
May i assume the pixels, which have this value, as oil ? can i refine this further ?
could you please give me the index of sigma0 values for Heavy fuel oils, so that i can do better seperation from the look alikes.
An index will definitely support, this seperation.
2. How i can change the colour of the drawn geometry?
3. How can i export the sigma0_vv in netcdf format? as i need to merge into an existing netcdf files .
I need to add band math for getting sigma0 from amplitude, could you please suggest an equation ?
where can i get the digital number ?
how can i compute the amplitude ? however it is displayed in pixel info
can i square the amplitudes for geting intensity? How our SNAP converts the amplitudes into Sigma0_vv intensity?
By the way, The intensities of bit mask show higher range (500 to 1000) but the sigma0_vv intensities are in lesser range (0.004 to 1.5) why so ? generally sigma0 is a dimensionless number, then why it is measured in db?
Please suggest me on the above .
while doing the oil spill detection, the sigma0 is computed from the intensity values for Sigma0_vv in intensity. But amplitude values are taken for computing Sigma0_vv in bil mask. Why so?
Hope intensity = amplitude^2
what was the value of the window size you ve used? 61 the default, 512 like someone suggests or a different one? what is the logic regarding how to set a proper window size?