Hi, I am using the Graph Builder on snap 4 on Mac OS X. When trying to build a graph, snap is very slow, even for moving a block around the graph. As a temporary solution, I am working directly with the xml file. It is very annoying though and I’d like to know if you have any idea on the cause of the problem.
I tried the Graph Builder both on Snap 2 and Snap 4, both have the same issue. Everything else, like loading the Sentinel-1 SLC files and running the graph work fine. I also compute the Snap Performance Configuration Optimisation, but that did not speed up the Graph Builder editing.
Hi,
I am experiencing this issue with SNAP 6.0-PREVIEW 5 (both on Linux and Windows) even with very short graphs (Read > Resample > Reproject > Write). The delay is much worse (tens of seconds) when using S3 files as graph input than when working with S2 files (2-3 seconds). With a longer graph and S3 input I have to wait minutes while switching between operator tabs or moving the operators on the graph.
Thanks
The problem is twofold here, or actually threefold.
First, the Graph Builder needs to validate the connection between the operators.
Second, during this validation, the Resampling is doing already some work. For this the geo-coding is necessary.
Third, because the geo-coding is used, it depends on which one is selected in the S3TBX options.
With tie-point geo-coding it takes ~10 seconds to switch between the tabs, with pixel based geo-coding it takes~33 seconds on my system.
It is an issue which exists in since the very beginning of the Graph Builder.
Thanks for the explanation and the tip marpet. Unfortunately, I was already using tie-point geo-coding but I can confirm that with pixel based geo-coding the problem is significantly worse (from around 1 minute to around 4 minutes per tab switch).
Besides the performance drop on each added block, execution itself is extremely slow. I mean extremely. When I perform those steps manually it takes less than 1 minute. The only time-consuming part is the final writing part. However, in graph builder, the same thing takes over 1 hour. I tried it on the server which has 32 cores over 120 GB RAM, the latest hardware inside, and I experienced the same performance. It means it is not hardware-related but software. How am I supposed to perform repetitive operations on multiple products? (Sentinel-1 GRDH products). I tried the same steps on batch processing and I observed the same slow performance. What am I doing wrong? Or is the software having issues?
On the Snap download page, it says ’ The current version is 9.0.0 (29.06.2022 15:00 UTC ).’ On the bottom it says: ’ SNAPISTA is a GPT wrapper for Python. Its goal is to provide an easy and pythonic way to write and run SNAP graphs using Python. The documentation and installation guide are at SNAPISTA .’ When you click the link it takes you to half loaded HTML and links there says 404 not found. Current version from 2022?? This alone shows how much care Earth Observation receives in the EU. Snap software doesn’t even have a normal intuitive way of cropping the image. Basic functionalities are half working. I still can’t believe this is what users receive from the ESA. How can you expect people and society to benefit from Satellites? Should I dive deep into every mission’s documentation and become an expert on those algorithms so I can write my own script to process the data?
It seems that working with SNAP is causing you difficulties. To better assist you, kindly provide additional details about your processing.
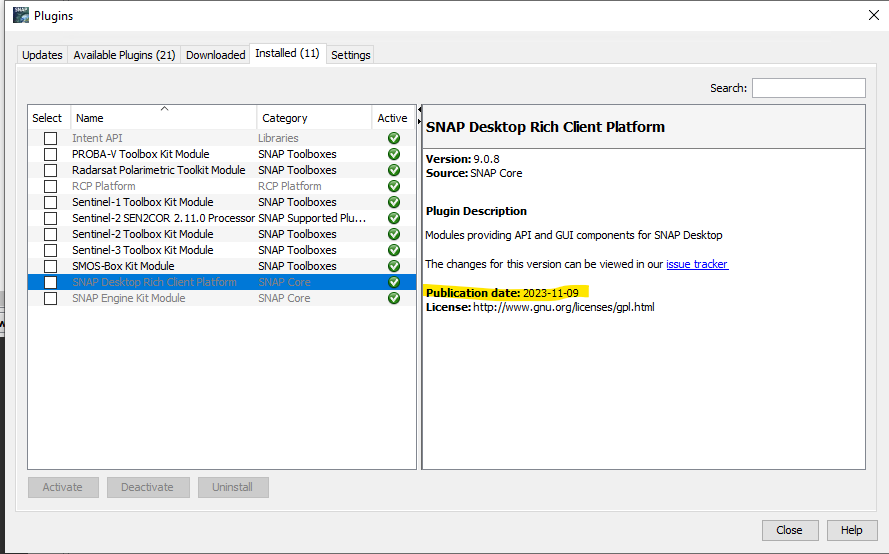
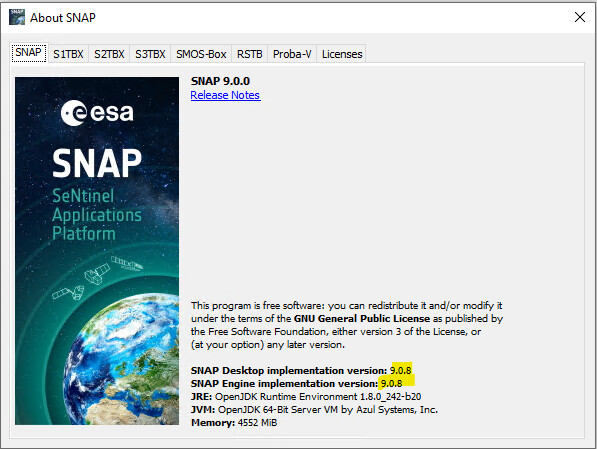
The current major version (SNAP 9.0) dates from 2022, but it has been consistently improved, with the most recent updates released in November 2023 .
This is known issue and has not been fixed properly. Generally speaking, if the output images of the operators in the graph are all in SAR image domain, then the performance will not drop significantly. However, if there is a processor whos output image is in map domain, e.g. the terrain correction, then the performance of the graph will drop significantly. This is because there exists a lot of redundant processing. I would suggest to remove terrain correction from the processing chain and run it separately.
@diana_harosa We should check that the technical FAQs have up-to-date info on how to squeeze the best performance from SNAP, what to do and what to avoid. I edited the FAQ-page accessible via the selection on the top banner (next to “GDPR”) to make it clearer where the technical FAQs are.