Hi,
Can anybody tell me how to build graph in SNAP?
I am trying it but SNAP is not responding while connecting graph. Is there any problem in software?
Hi,
Can anybody tell me how to build graph in SNAP?
I am trying it but SNAP is not responding while connecting graph. Is there any problem in software?
can you please show a screenshot of your graph?
There are a lot of good videos on this:
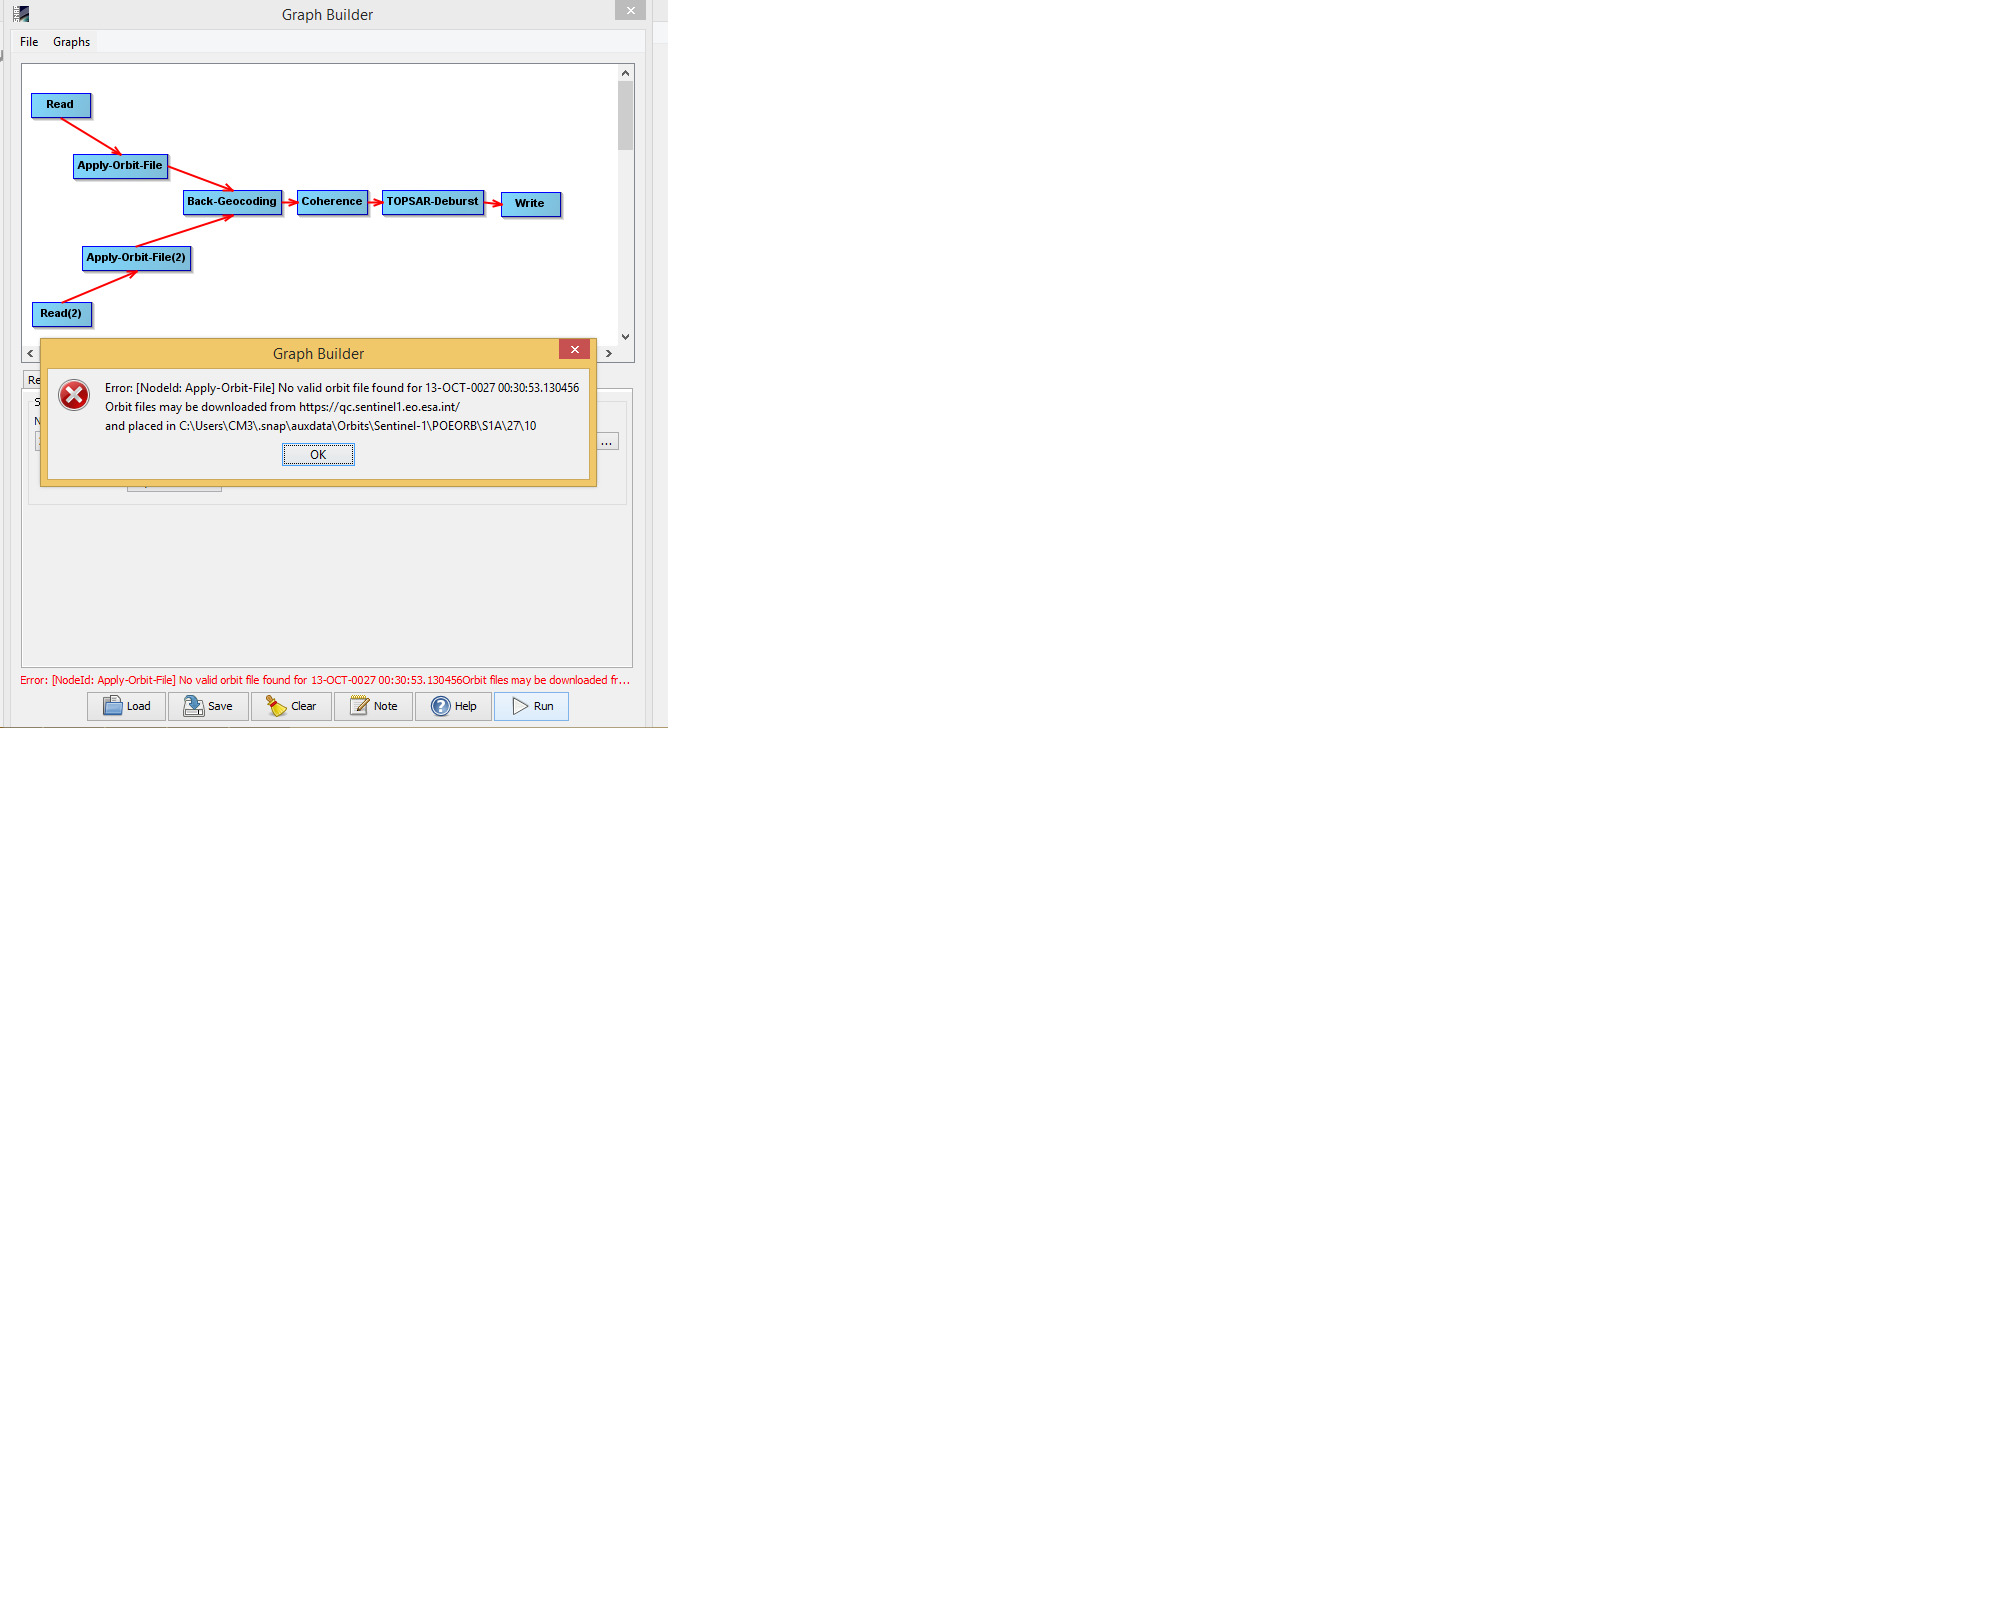
Thanks for your reply AB, i have posted snapshot of error. please have a look.
You graph is not wrong. Reading the error message would help 
It states that no orbit file is found for your file. The date however is suspicious: 10-OCT-0027.
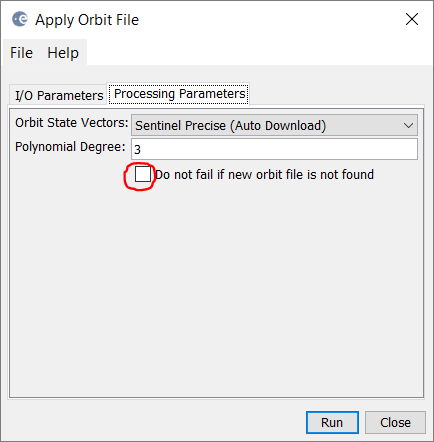
You can prevent this error by checking this box:
Thank you once again AB. Can i ask any other questions in future if i face any problem?
That is what this forum is meant for 
Just make sure that you are aware of the basics and use the search function. A lot of issues have already been discussed and cleared in here.
http://step.esa.int/main/doc/tutorials/sentinel-1-toolbox-tutorials/
Hi AB,
Is S1A SAR data suitable for agricultural crop classification?
If it is, can you please guide me?
Why don’t you have your own research on it?
Neither is there a standard solution nor do I know anything about your study area, your data or your aims. You can’t expect step-by-step solutions for whole applications.
Please use the search function, there are so many topics in here which discuss how it could be done:
sorry, you can’t just ask for a whole analysis.
Please check the tutorials for pre-processing which show you how to deal with S1 GRDH data.
Then have a look at some studies to get an idea of what different approaches in agriculture exist.
Search in this forum, there are lots of great examples:
Radar remote sensing isn’t something you can master over night and just apply by following a recipe. Read some stuff, develop ideas, discuss problems in here - you are free to make your own mind.
Here are some great documents / tutorials if you are new to SAR remote sensing:
Introduction to SAR remote sensing
A tutorial on synthetic aperture radar
Forest Monitoring with multi-temporal SAR data
Agricultural Applications with SAR Data
Guidelines for SAR interferometry
If you have problems at specific steps of processing - feel free to ask. But you will have to come up with own approaches.
Agreed, this forum cannot substitute for basic education in remote sensing. One should at least do a search of the available scientific literature in order to see what kind of algorithms others have tried.
Then, trying out different algorithm variations is exactly what is going to make one a remote sensing expert in the longer run - running a turnkey-solution teaches one almost nothing.
I must support @ABraun here.
Just asking “Could you do my job for me?” is not the right behaviour.
Such kind of questions occur more and more often here in the forum.
The following is addressed to all forum users.
You are working in a scientific domain where research is the biggest part of the job. Asking such question in a forum is not research. The questions should be more specific and not just questions where the answer could be a whole thesis.
There are projections to answer these kind of questions. These projects take month/years and they get paid for it.
It’s neither ABrauns nor my job to do it for you.
Helping you if you are stuck is fine. But you should show a little more effort.
You are right guys, thanks you for your replies
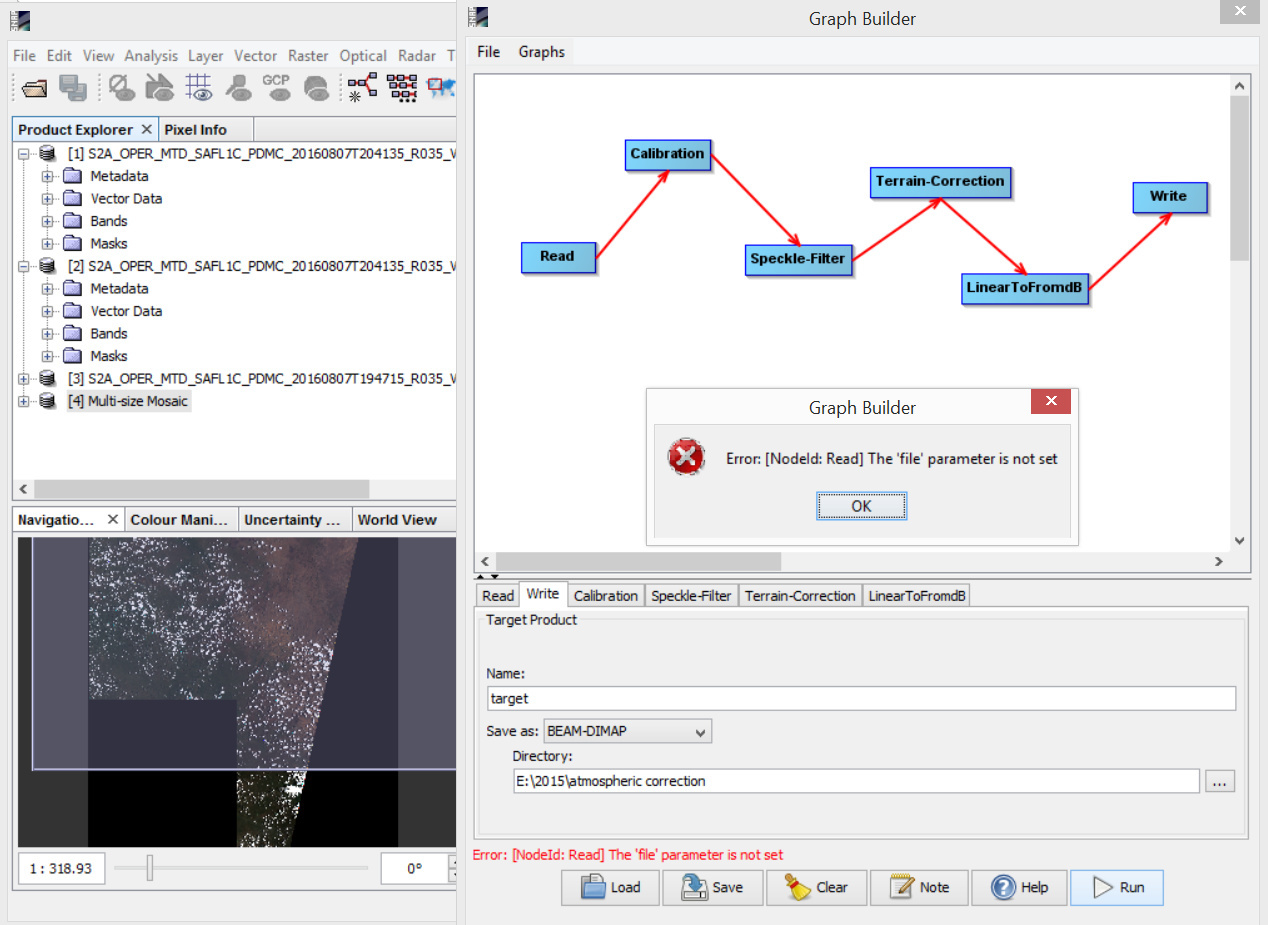
The error says: [NodeId: Read] The ‘file’ parameter is not set.
So, I would look into the settings of the read node and check if I have set the source file.
Hi, I’m new here and SNAP is new to me. I would like to use the graph builder. I have several datasets that I want to compare on a specific point, but the point is different from dataset to dataset. So I want to use the Graph Builder that will read the dataset and look for the specific coordinates and write out the values. So it is most of the time salinity, temperature, wind speed at different times. Can someone explain me how I can build a graph with which I can select the data set and then it write out the different values from the different images in a table on that specific point. Is this possible with SNAP? At the moment I open the data set and use the pin placing tool to select the specific point and then use the histogram tool to read the value and copy and paste the value into a table but this is a lot of work. So can I simplify it?
What you are looking for is the PixEx tool. There you can provide the dataset, define the coordinates and filter by time conditions. This should do what you expect. You don’t need the Graph Builder.
You find it in the menu at Raster / Export / Extract Pixel Values.
See SNAP Online Help
![]() Marco from EOMasters - Mastering Earth Observation
Marco from EOMasters - Mastering Earth Observation