Can you provide the asset ids or the area that you are looking at?
The general answer is that sometimes there are duplicate assets, and EE is not always doing a great job deduplicating them. Fortunately, scihub just started providing their full asset catalog in CSV files, so I’m going to use that for proper asset cleanup.
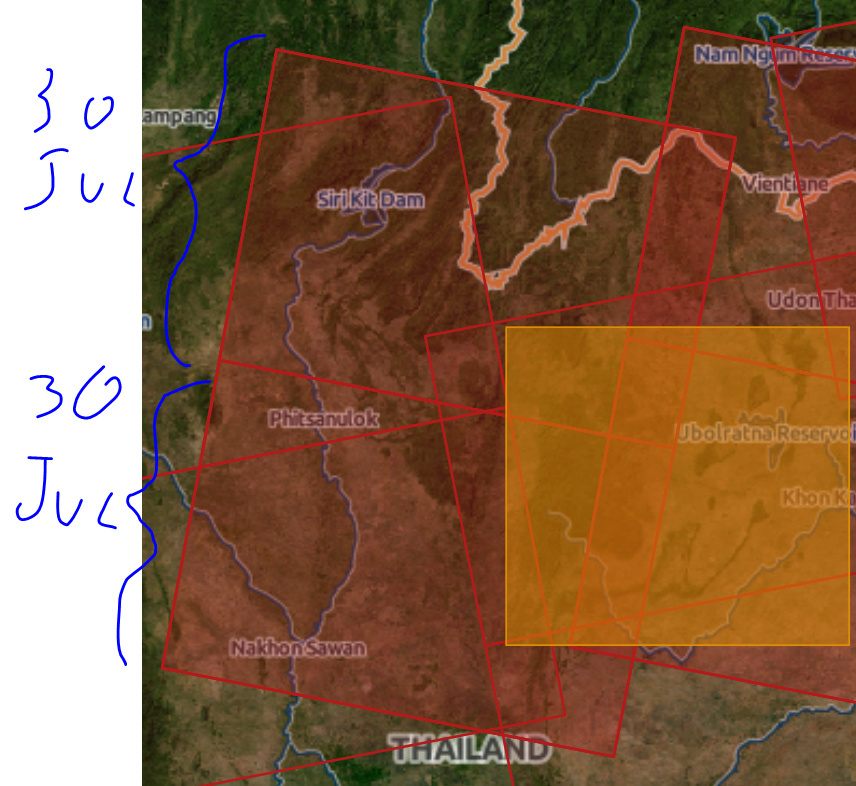
What do you mean with “provide the assets”? Anyway, I’m looking at an area in Thailand.
Although I have another question about the time series chart generation in GEE: in the script for the chart generation I set up the option for the mean generation… but actually it seems that it doesn’t work!
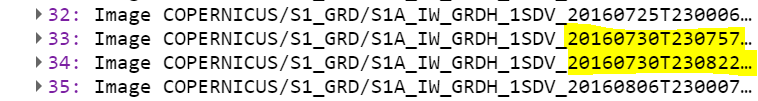
These are 2 adjacent frames from the same orbit (“overpass”), because your area straddles both. Logically, they are from the same date, 25 seconds apart, which is the typical time slice for a GRD frame. There is no duplication.
@simonf, are you still only updating the S1_GRD once a week? I’m trying to find a solution somewhere with mosaic’ed Sentinel-imagery that is updated as soon as images appear over at ESA.
Nice! I just saw that the latest image was from the 17th. I’m using it to detect sea ice and therefore it’s crucial for me that the images are as fresh as possible.
How do I correct this error (red circle) in GEE? I want to perform flood mapping but when I mosaic the scenes, the black edges of the images also appear.
The updates of the top-level computed dataset are now daily rather then weekly. But yes, it still takes about two days for a scene to appear in EE. We are currently working on making Sentinel-2 updates be faster then daily (S2 processing is simpler than S1). Once that is stable, we’ll start improving S1 latency.
Dear all,
I’m new both in SAR and in GEE, apparently, I’m bad also in scripting. But I want to do Sentinel 1 time-series analysis for forest biomass. SNAP didn’t support doing batch for many scene’s preprocessing so I had to switch to GEE. Here I have some problems and I would appreciate any help.
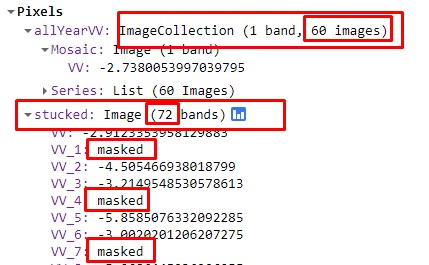
the amount of scenes within the given parameters for the whole year are 60, but the elements are 72. After stacking the amount of bands are finally 72 and they contain also those 12 elements without value (called ‘masked’). How I can get rid of those elements? (i’m attaching a screenshot)
while using Refined Lee filter, is it mandatory to apply it for the each single scene or can I use it after one month averaging (which I’ll be using later for time series analysis)?
Metadata says in DEE the terrain radiometric calibration for S1 is done with sigma naught output. Is there a way to get the gamma naught or should I start preprocessing the very raw data on my own?
Here I’m posting my code: https://code.earthengine.google.com/e0a867c01a79ed6f8355562b28edd26d
I suspect Refined Lee Filter would behave differently on a composite because speckling would not have the same characteristics, but I’m not a specialist. If you don’t get a response here, post in the EE user group: https://groups.google.com/forum/#!forum/google-earth-engine-developers
I shared the study area public. The thing is shows 72 elements in Console, but when you go on Inspector and click on the study area map it shows 60 images and 72 elements, and as it’s on the screenshot, some of the elements are just without value and called “masked”.
Inspector just skips images that have no data for the point you click on (if you click on areas at the bottom, there are only 5 images in some places).
Generally you don’t need to get rid of masked-out pixels, as they are handled correctly (eg, they won’t skew per-pixel averaging). Are they creating some specific problems?
I’m still not sure if it can make problems later on, but it’s good to know that they don’e affect on the averaging. Just was weird that those 60 images are constantly available within my study area (’‘table’’ one).
Thanks for the help and the tips.