Dear thho,
Thank you for your work to give an example for SNAP-StaMPS tutorial.
Just like you said, the noisy ifgs is not the major problem, however, when building the stack with BackgeocodingOP, the default resample method is BI(Bilinear_Interpolation), not NN(Nearest_Neighbour),and I do not meet any problem with the default method.
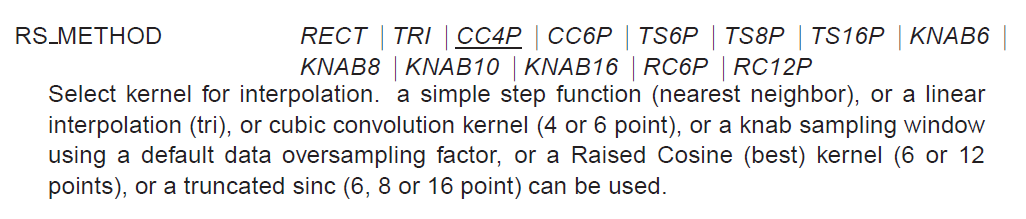
In theory, these two resample methods are not the best choise, according to the manual of doris_v4.02, Raised Cosin is best(theroy 0.9999), here are the screenshots of RESAMPLE step in Doris.
Doris manual:
As for better trend/unwrapping result, in my experience, I think these parameters should be more careful in StaMPS processing: density_rand in step 3 weed_standard_dev and weed_time_win in step 4 unwrap_grid_size and unwrap_time_win in step 6
And I am also very interested about your TS result, as I know, StaMPS can only get time linear deferomation, how did you get TS result like you plot? And did you use other data or software to subtract atmosphere?
Hi AndreyVahtanov,
Thank you for your report, however, I can’t see where the problem is just by your screenshots, can you show me more information about xy, bperp_mat or other matrix?
Hello everyone.
dear all user,
after all processing complete, now im facing new problem. the problem happened with stamps and vistamps
in stamps :
viStaMPS
Writing output files…
GETPARM: small_baseline_flag=‘n’
55886 ref PS selected
Error using load
Unable to read file ‘mean_v’: no such file or directory.
Error in ps_output (line 92)
meanv=load(meanvname);
How did you manage to plot colored dots on a map? In other words, what is the command you used in StaMPS to get these dots to show up? Mine are just square pixels with displacement values.
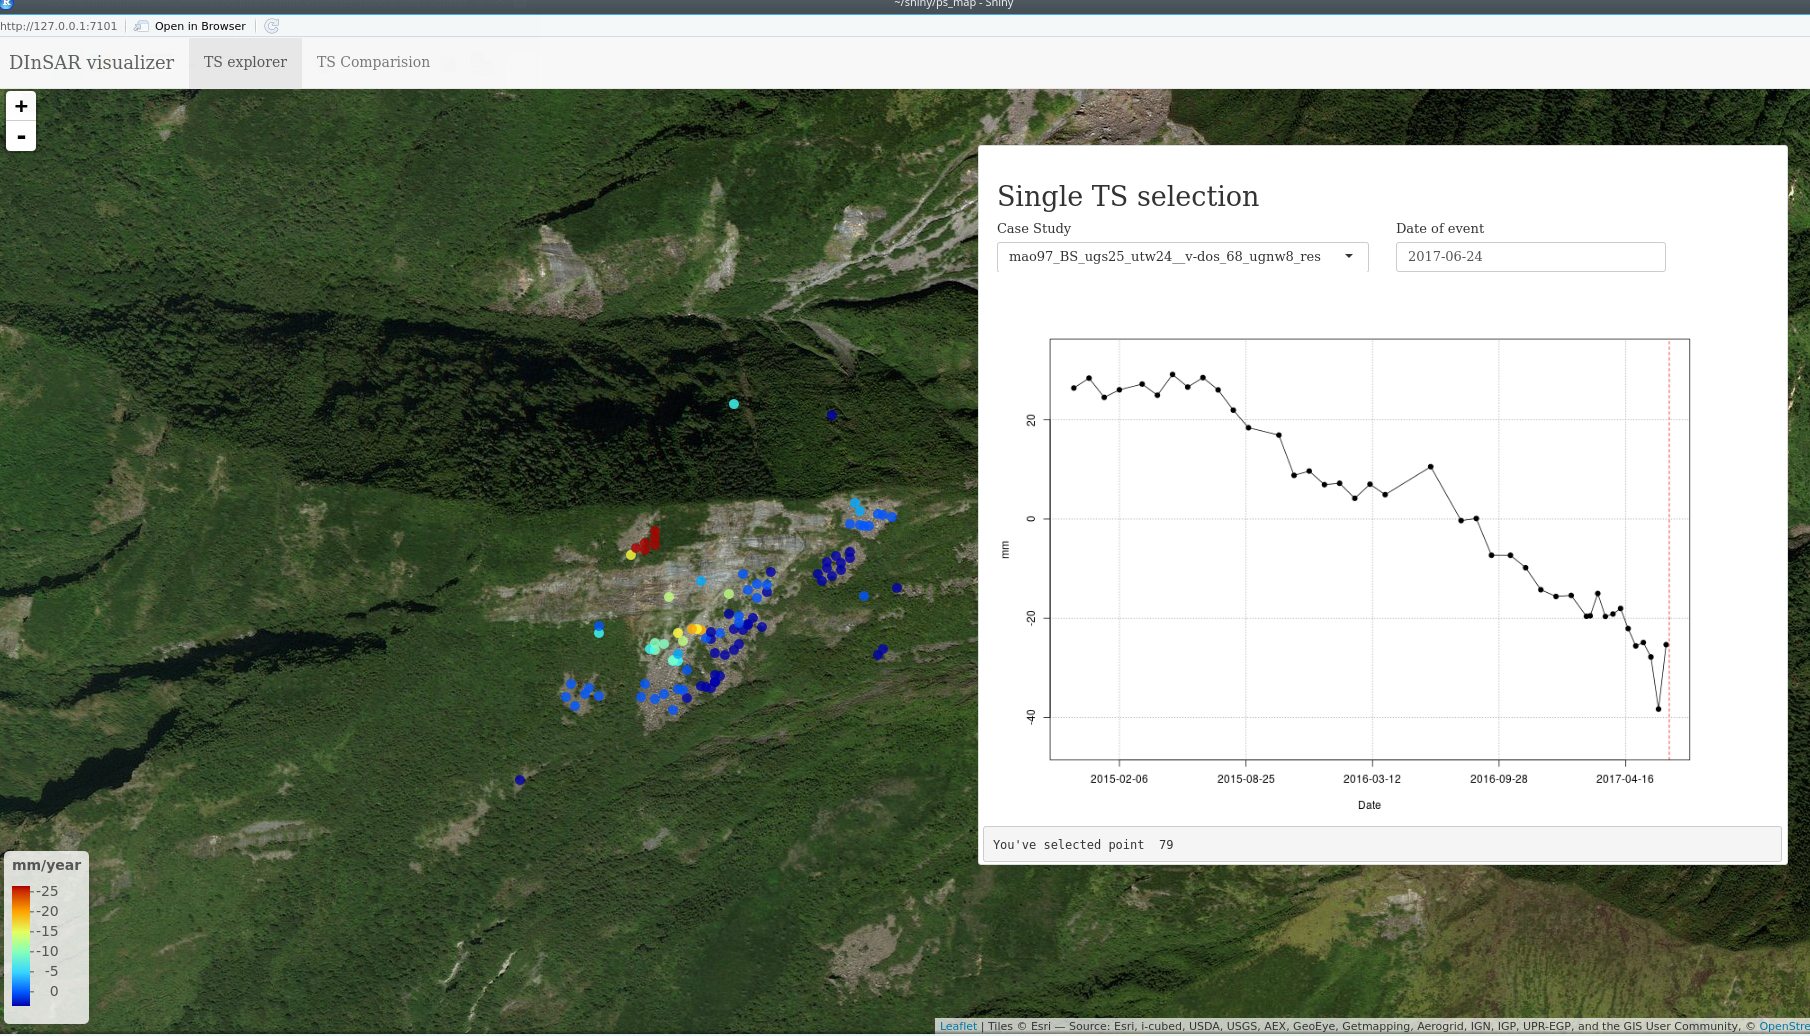
in order to visualize the data in a manner where you can see and click single PS and have the deformation time series plotted, I exported data from matlab with this commands
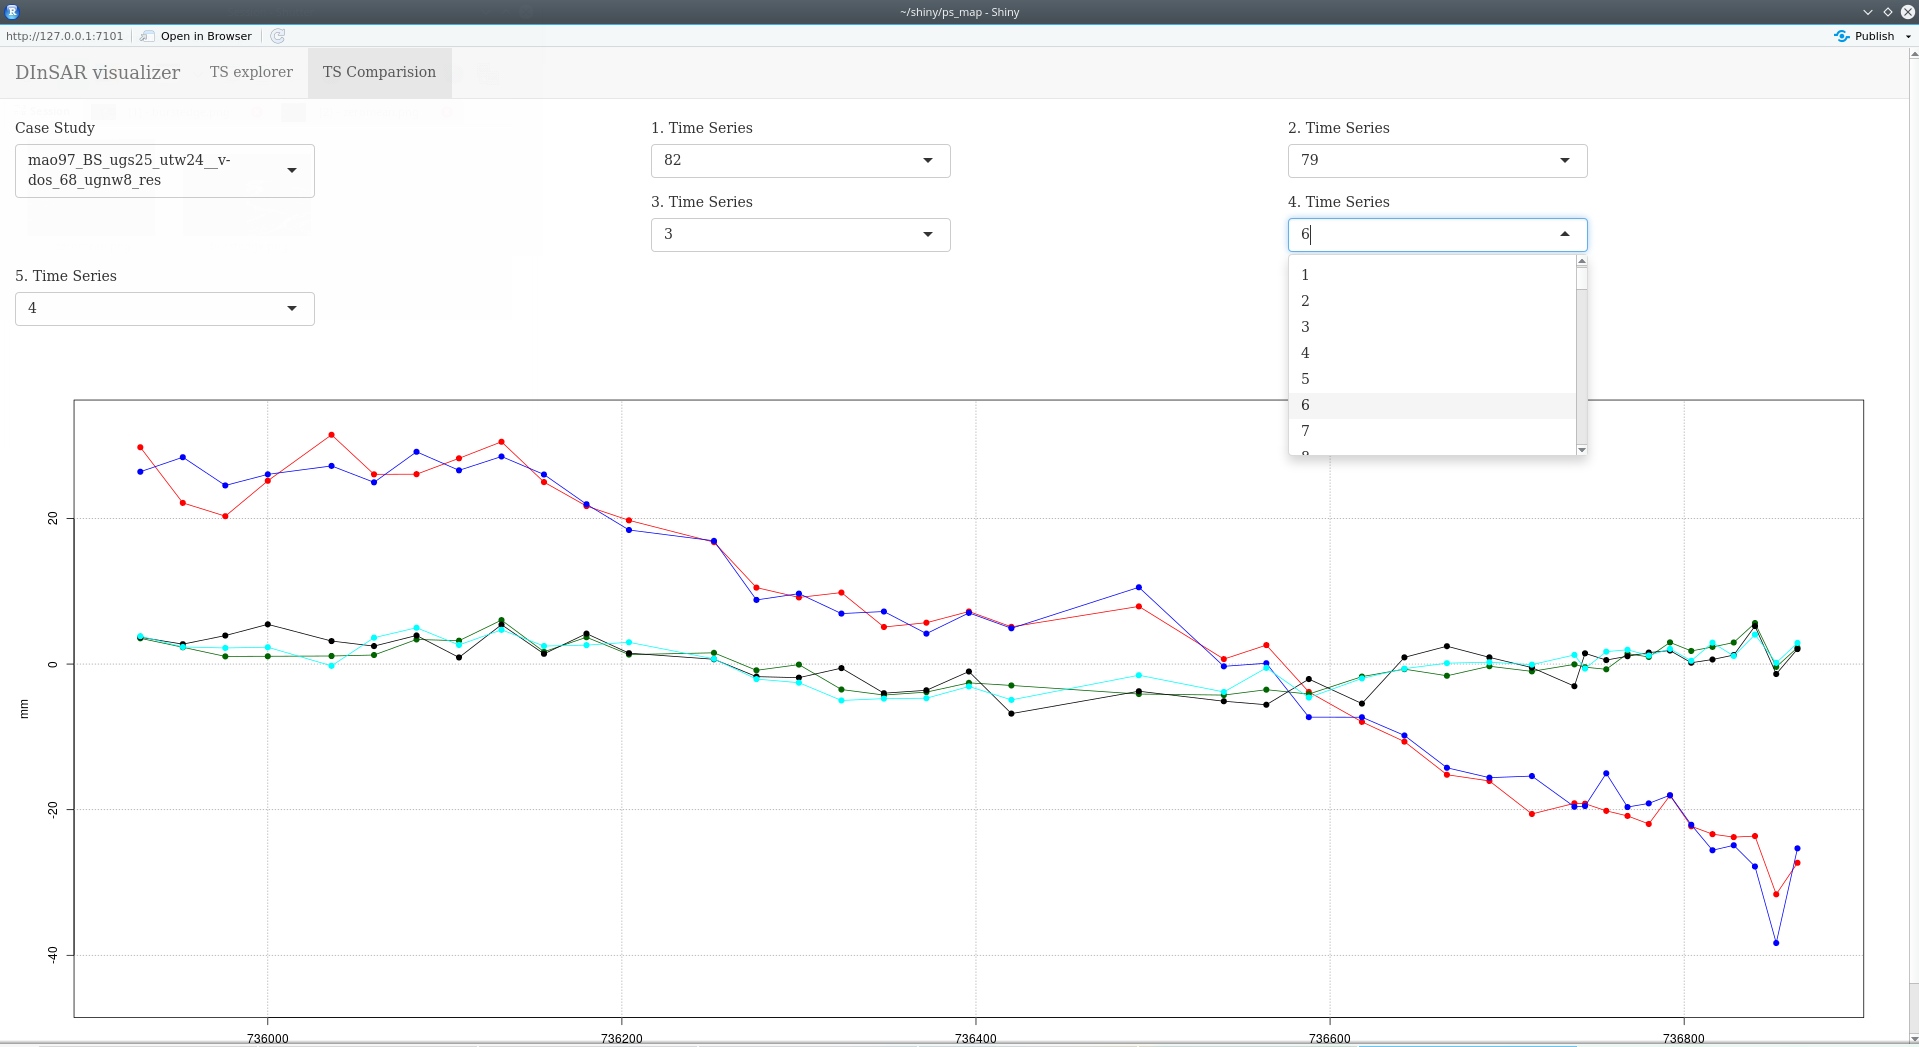
The exported .csv was than imported to a R Shiny application I am currently developing, that is what you see on my screenshots. The application allows you to click single dots to look up the ts for the dot and compare up to 5 ts in one graph…the status of this app is somewhat beta and I am changing and adding features all the way, give me a few days and I can share a beta version. To prepare yourself, you need R, Rstudio, and the packages shiny, colorRamps, lubridate and leaflet
I changed some parameters mainly in step 6 in stamps and the PS data looks now like that (my “best” result) even that the trend becomes more clear and the selected points look good, in the end, the last point is unwrapped wrong or disturbed.
Until now I do not use any other software to subtract atmosphere, I know about TRAIN but I have not implemented it yet…maybe this would help. As you know I am trying hard on SBAS approach for this case study and hope I get a more satisfying result for the last and most interesting points in the TS plot. I think this could work because in PS the btemp is the largest for the last point, which is clear and a problem of the approach and in SBAS this problem may be solved…so lets see what happens next week
Hi
My name is Daniel
So I’ve been working based on workflow described by amazing people such as @katherine , @thho, @FeiLi
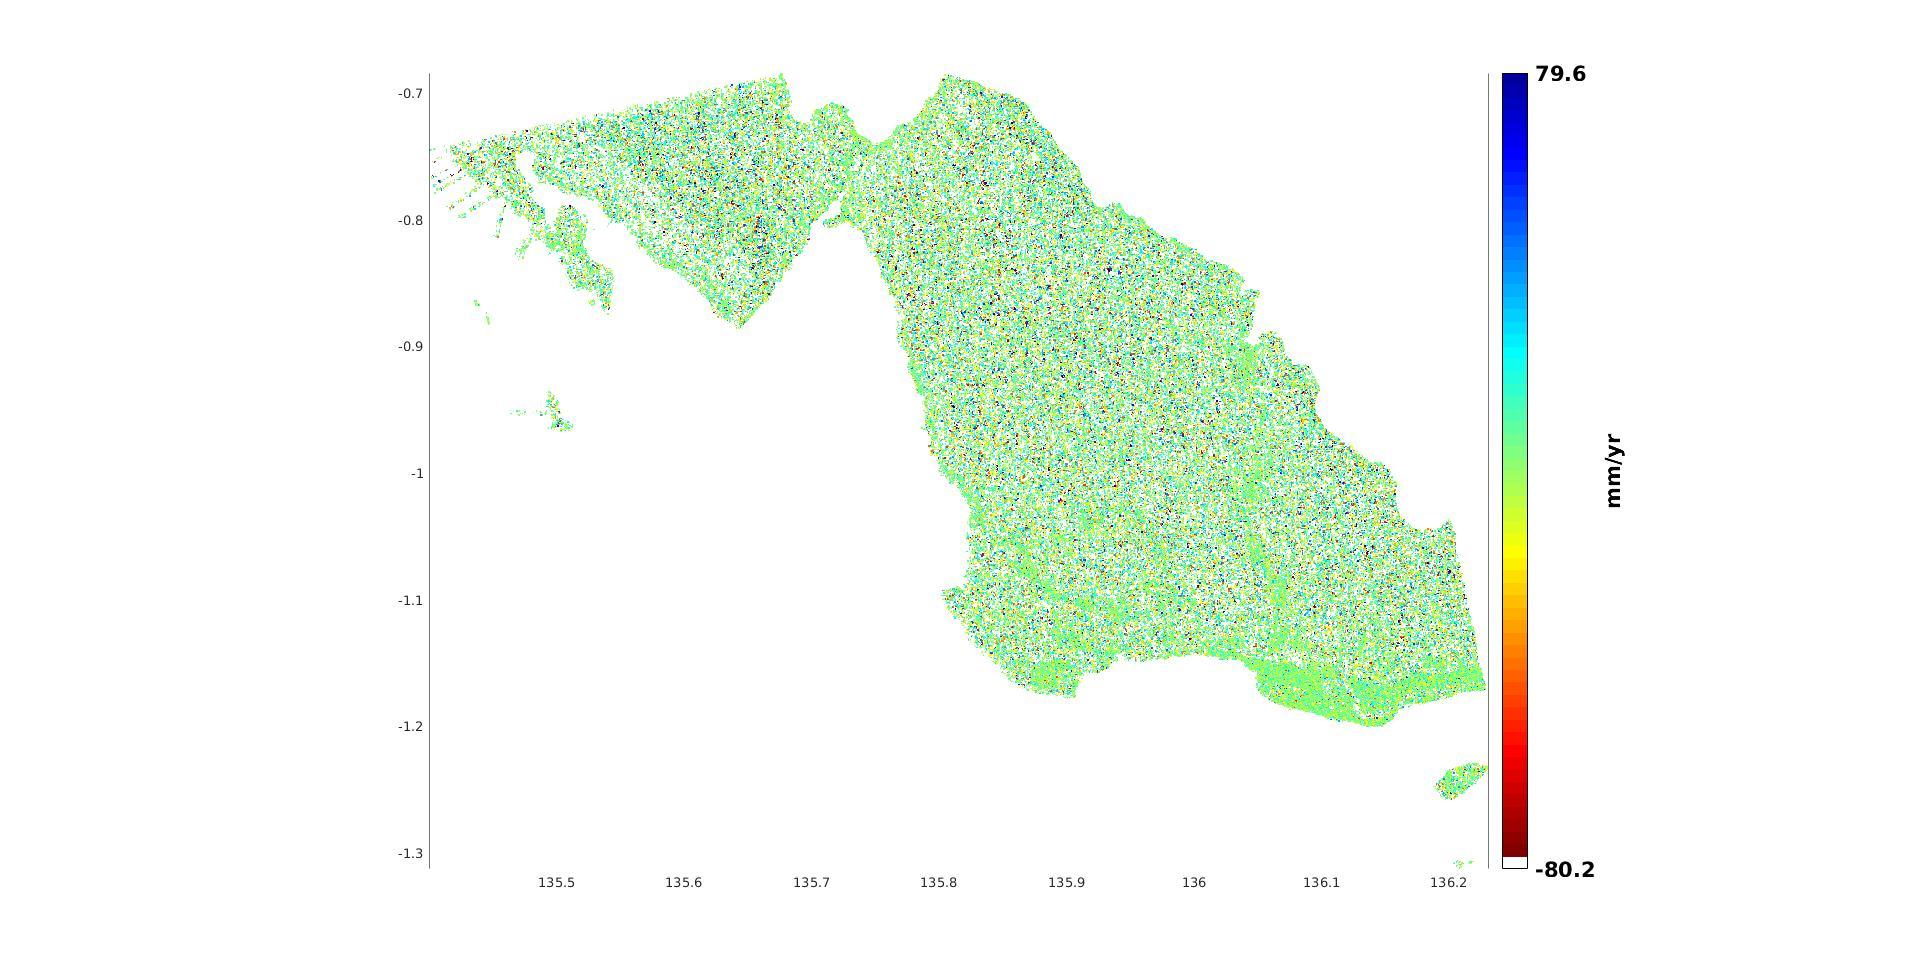
And I get this result using ps_plot(‘w’) command
so using 7 SLC data to create 6 interferograms
my question is since I’m very new at this and still struggling and learning on inSAR maybe you can take a look at my result and give some interpretation.
And I have question for @thho in order to export the point to CSV using script in your post How to prepare Sentinel-1 images stack for PSI/SBAS in SNAP
is it run on Matlab command window or write an m file and then run it on matlab?
or is there a default command in StamPS to export PS to CSV?
good to see that the workflow works
I can not really help you to interpret the images, since I am new to this topic too, I am struggling myself what is deformation, what atmosphere etc. Maybe someone with more knowledge can help you.
Regarding your question, I would suggest to use the lines step by step copy pasting them to the matlab console, because when you do ps_plot(‘v-do’, ‘ts’) you have to do some manual input in defining the plot area and radius. I really recommend to do this just when a reference point is set! Your results will always be heavily affected when relying on the mean of all points of the image…creating and using the csv output should be discussed here I suggest. No there is no default command to export from StaMPS as far as I know, I used a combination of objects created during the StaMPS process and by some ps_plot() commands to build table which can then be exported as csv, it is somehow similar with the google earth kml export which you can use in StaMPS…
hello guys
i was able to run the psinsar test thx to members from the group and special thx to @thho. but trying to run a new stack i am getting the following error. anyone have any idea why this is coming and how to correct it
Dear FeiLiu, I looked you question about stack averaging but I didn’t found an answer. Do you know why it is necessary put dinsar averaging stack and not dinsar stack?
All the best,
Antonella
Dear Sir
I am also working on Landslide deformation detection. Wish to do SBAS or PSI analysis. I do not worked with Stamps.
Now SNAP is also being made capable to handle PSI/Stamps.
What would you suggest ?
Will you please help me in Stamps processing?
Regards
ASVirk
SNAP offers you to perform a preprocessing and export to StaMPS for PSI, SBAS is not possible yet. If you want to join a group of people testing the SBAS workflow with SNAP-StaMPS please have a look here.
I I recommend to read this thread, the papers published by Andy Hooper in which he presents StaMPS and the literature cited in this papers. There are some slides which helped me to become more familiar with the idea, here some more for SBAS. There are other sources that helped me to understand SBAS/PS, this thesis was very helpful for me, but here I will stop recommend literature.
when you feel comfortable with the theory, I suggest following one of the summaries for SNAP-StaMPS workflow given in this Forum, like this one.
The processing in StaMPS somehow depends on your dataset, how many images, how large is your studysite, which topographic and atmospheric conditions, how large is the area where you think a landslide occurs etc. I can not help you answering this questions, it is to specific (for my level of knowledge) and I have to dig deep into each dataset which I process, to set parameters right in StaMPS. But do not feel discouraged, StaMPS is a great tool, you have to invest some time, but you will become more and more familiar with your data and the parameters. So reading some recommended theory and starting preprocessing in SNAP and processing in StaMPS step by step is my advice. Many questions are already answered here or in MAINSAR google group. Gathering the information and hints is another good way of learning the process
Good luck and I am curious about some of your results!
Hello! I coming back to my quastion. In Some cases (most of all) mix index in Index_NaN is more than lendth of bperp_mat.
For example max index in Index_NaN is 24454944 and length of bperp_mat is 24454943.
Maybe you know the some reason of it and maybe you have some decision?
PS: some addition information. If the pixel size of product is odd - processing works. If it is even - send error in ps_load_initial_gamma in string 191 - index Index NaN is bigger then size of bperp_mat. Or in 205 string - diferent size cann’t concatinate.

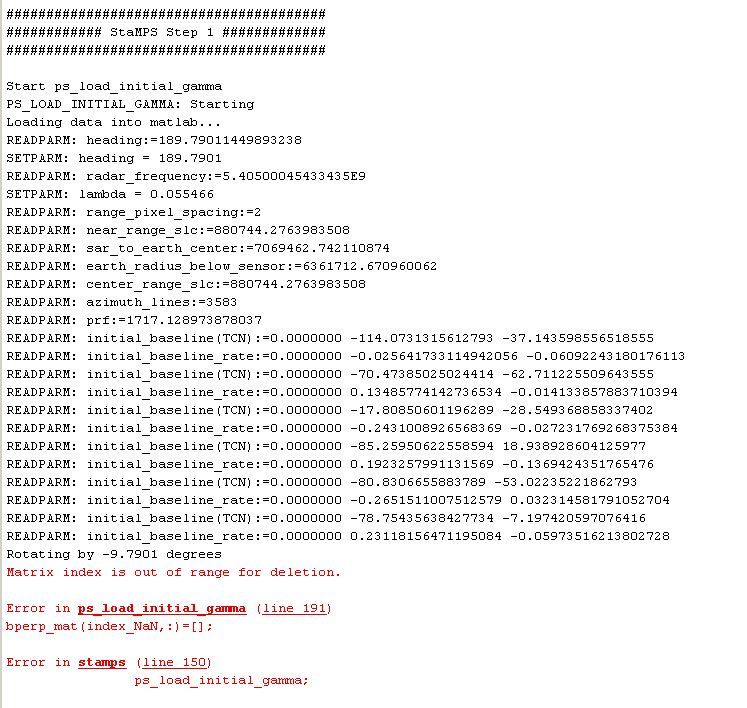
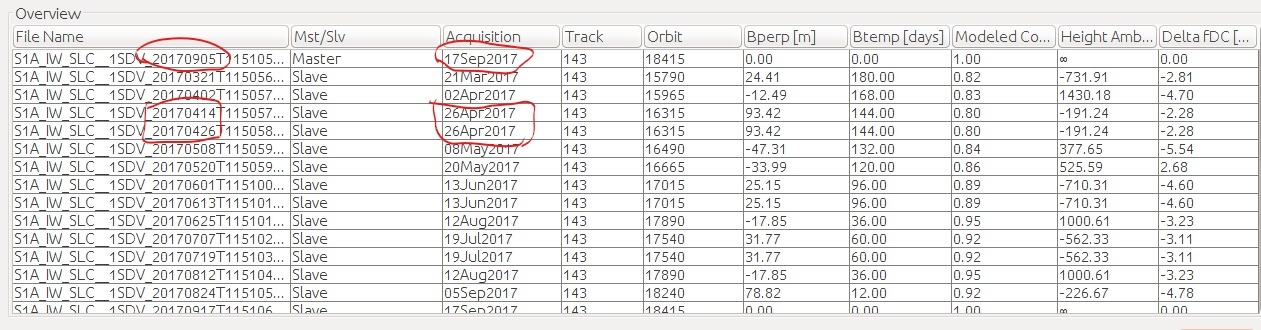
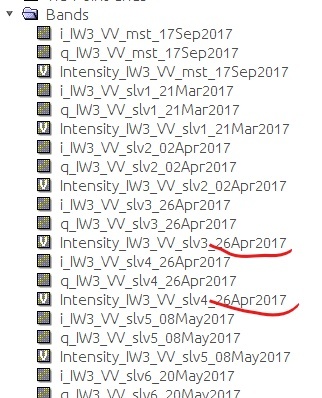
 please look at the place I marked.