Is there anyone to kindly explain how the look direction change (Desc. vs Asce.) with different Incidence Angle may lead to different classification results?
e.g., Ascending: Incidence Angle (near-far): 38.75-41.20 obtained on 10 Aug.
e.g., Descending: Incidence Angle (near-far): 46.3-48.2 obtained on 13 Aug
From the same area. The Asce. image covers a larger area
For water bodies it shouldn’t make any difference because they don’t underlie topographic variation.
There is a relationship between the incidence angle and backscatter bias but this applies to slopes towards/away from the sensor only.
If your water areas have steep coasts there could be some shadow or foreshortening depending on the flight direction, but for Sentinel-1 this would make only a pixel (on the land).
Very steep coasts at 100 or more meters above the sea level could indeed cause problems for the exact discrimination between water and land.
Thanks a lot for your good explanation. You re right, those water areas have been identified on Des., can be also found on Asc. water mask more or less.
The data is radarsat 2. The area is not that steepy <12 degree.
But one thing odd I have noticed on 2 out of 24 images was that these two images (both Descending) had a much lower range for texture analysis compared to other ones under the same condition.
e.g., these two des images , texture water range <3
but for other ones including asce and desc, the range was <15
The Same area, only different date acquisition. It s hard to justify that! Why backscattering values only for those two images were much lower than others. The weather condition for all almost was in calm condition. Any ideas!
No, all datasets have been run under the same loop setting! SRTM 3sec was used for TC, and all GLCM setting remained the same for all! Resampling Bilinear for all!
Small differences in weather conditions can have a big impact on the water backscattering.
Are you saying that the backscattering intensity for the 2 images is also much lower than for the remaining 22? If the backscattering is low enough, what you see in the image is the noise floor. I don’t know about the texture range you are using, but maybe noise has a lower range than water backscattering.
SAR is seeing the small capillar waves on water-surfaces so the backscatter depends on wind-conditions. If you can find a wind-free scene water bodies have very low backscatter-values.
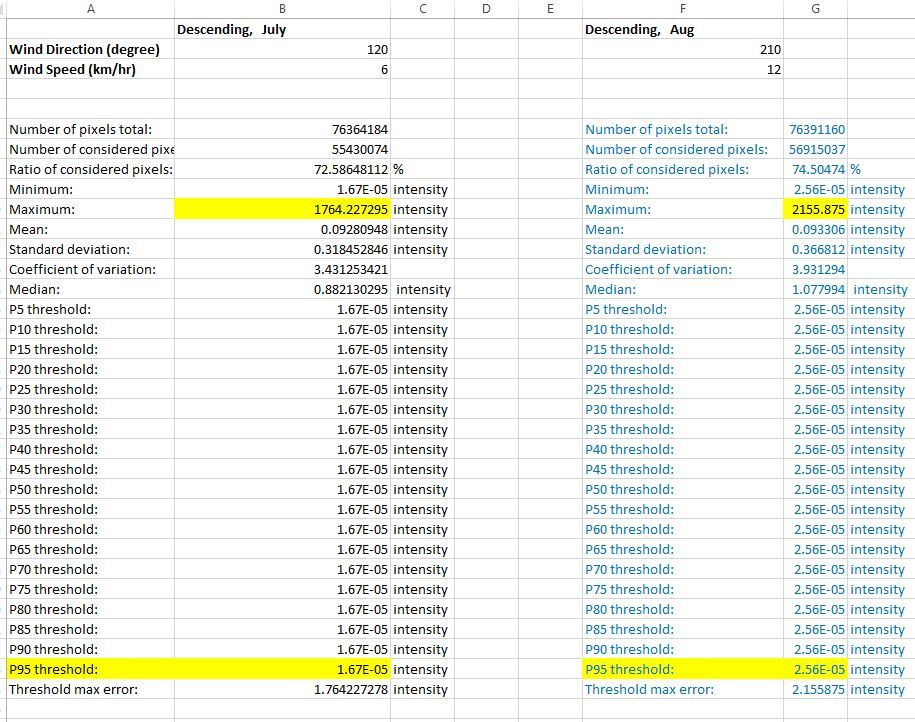
I have compared two Descending images from the same area, same year: July vs. Aug.
the most odd thing, on the statistics report the max value for sigma0 is extremely high>>1 while the visual inspection can not find such a big value! Also Percentile 95 shows a normal range for sigma0 <<1 (please see the attached TC statistics- Linear sigma0 values).
Later on, when I get GLCM for both images, July has a smaller range< 3 and Aug, range <10 (under the same setting)!
The wind speed for smaller backscattering value is 6 km/h and wind direction 120 degree, while for another one is 12 km/hr , and 210 degree.
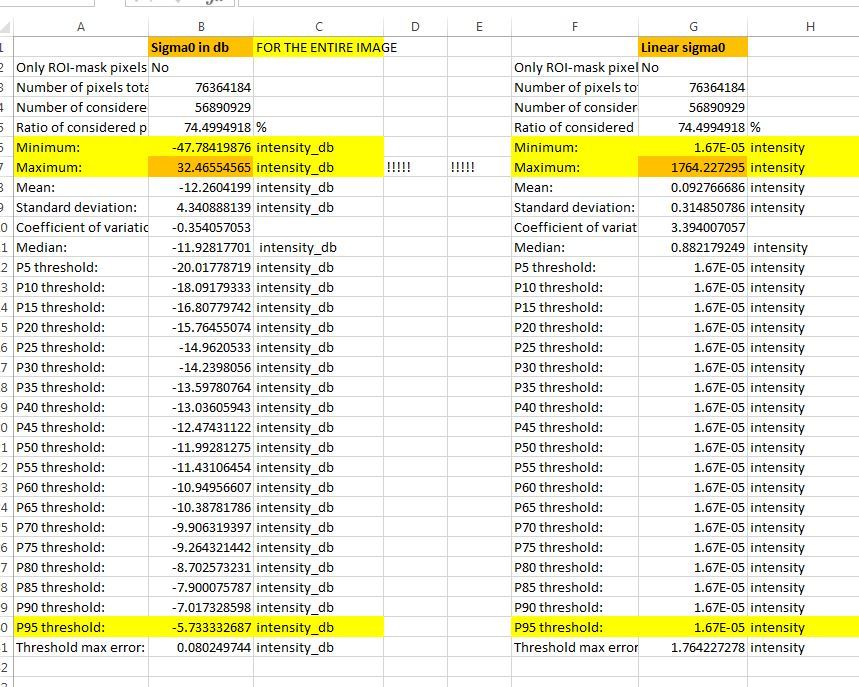
There seems to be something wrong with those statistics. I don’t believe the values of all the pixels up to P95 in a water body can be stuck at the minimum value. And this minimum value is below -40dB. RS2 has some modes with very low noise floor, but I don’t think it is as low as -40dB.
Homogeneous sea clutter is usually modeled with distributions like the Gaussian, gamma or k.
I just did 10log(2.56e-5) = -46dB
Are you sure those percentile values are correct? An image where at least 95% of the pixels have the same very low value will look strange. Or maybe some very wide black borders have been added?
Yeah, I see your point. But all I am doing is to get a simple statistics over the Entire Image. The oddest thing is the Max value for Sigma0>>>1!!! However, such a value can not be found on the image.
I did run again for both linear and db sigma0, the same result though! No clue!
The percentiles in dB make a lot more sense (and are different to the percentiles in linear units).
I don’t know which tool you are using to compute the statistics.
The min and max values may just be of some freak pixels. I guess 32dB is actually possible from very strong man-made scatterers. If the tool reports max=32dB and that’s not true, then that tool is not very good.