please can you tell mu where is this tutorial?
http://step.esa.int/main/doc/tutorials/sentinel-1-toolbox-tutorials/
There are several depending on which data you are using
1 Like
i’m trying to generate a displacement map (tutorial: Sentinel-1 Stripmap Interferometry) using sentinel images and i think that this tutorial uses not all necessary filter…what do you think?i want determinate the displacement in Italy after the Amatrice earthquake.
What is the meaning with displacement map? Is it unwrapped from wrapped one?
Hi marjanmarbouti
Yes, effectively, this is after of the unwrapped…
Displacement map is the result of the converting the Unwrapped phase to Displacement, and that means the movement in your study area (LINE OF SIGHT)
Firstly Towards the Satellite and that means Uplift.
Secondly Away from the Satellite and that means Subsidence.
Put in your mind that The Line Of Sight (LOS) doesn’t mean Vertical movement.
Also I’d like to draw your attention to take a look at this topic
4 Likes
Dear falahfakhri, Thank you so much. I look at LOS to horizontal displacement and to my understanding, it is differential interferometric SAR (DinSAR) but I think you know that I am working on fast ice, then I do not have any DEM on sea ice (as ice is on sea) so I can not use DinSAR. Am I right?
Sorry for delay answer, But first of all the title of this topic is the interpreting the results … So any results of InSAR despite of the technique is one of two things the first one is the displacement and the second one is the height or DEM.
The second important thing in your case that you are trying out to measure the horizontal movement of ice, I’m not sure about the workflow of your processing and also I think you are using GRD or are using SLC?
But in case you are using SLC and you are trying out to measure the horizontal displacement for ice so in this case there is solution. I’m working in now.
how did you put USGS interactive map in?

thank you so much!!

Hi all,
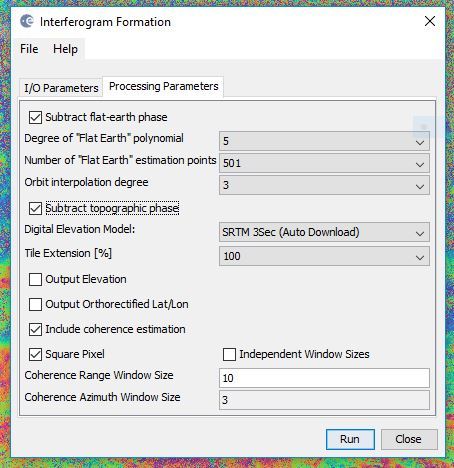
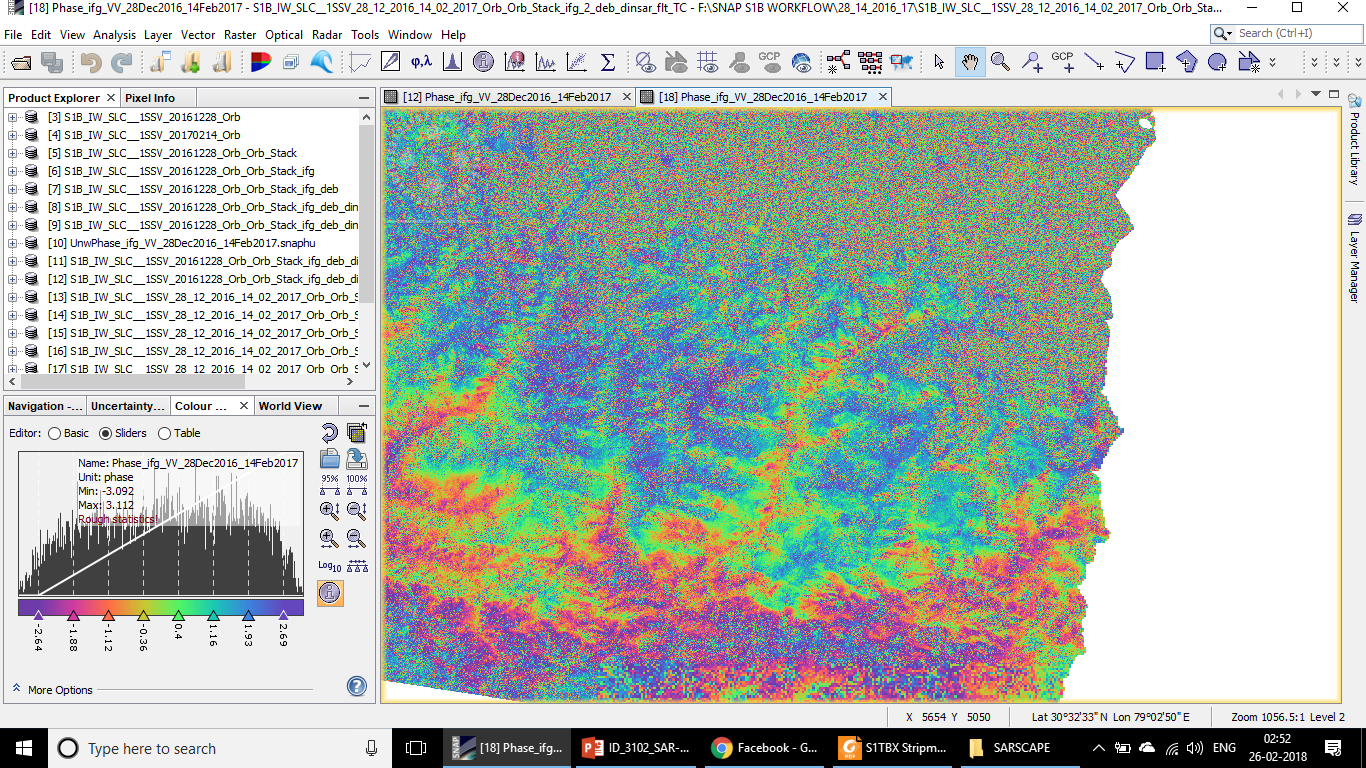
Here are two interferograms obtained from two Sentinel 1B SLC products. The two points within the rectangle represent locations of two earthquakes of 5.1 mag. The polyline feature added is a valley that may be along some fault. The first interferogram was obtained after removal of Flat Earth Phase and the Topographic Phase, while the second one was made using only Flat Earth Phase removal.
***This region lies in Central Himalayan terrain.
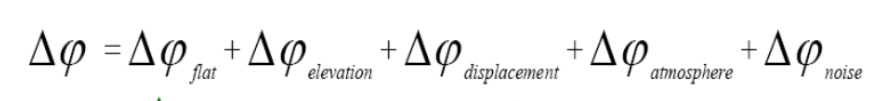
The phase difference can have contributions from five different sources:
Δϕ flat is called flat Earth phase which is the phase contribution due to the earth
curvature.
Δϕ elevation is the topographic contribution to the interferometric phase.
Δϕ displacement is the surface deformation contribution to the interferometric phase.
Δϕ atmosphere is the atmospheric contribution to the interferometric phase.
Δϕ noise is the phase noise introduced by temporal change of the scatterers, different
look angle, and volume scattering.
Anybody suggest, Why second interferogram is devoid of such fringes?
Which one will give better results for displacement mapping ?
1 Like
It looks like your top interferogram still contains some topographic phase. Please check your processing.
This region lies in Higher Himalayas. Will topographic phase removal help…?
Baseline-length affects the density of Fringes, and topographic phase removal should remove almost all topography-related fringes. Something seems to be off in your processing.
Also your temporal baseline is long, you would get better results by taking the shortest temporal baseline possible around the earthquake of interest (should be 12 days over the Himalayas).
2 Likes
How can we export these displacement values related to Pins plased in this map in QGIS or in Table form.
Regards
ASVirk
I am not sure if I understood you properly. Lets say there’s an earthquake occurred in 10/6/2016 and I shall create an interferogram using image pairs before and after the disaster.
which two image dates should I choose
7/6/2016 - 12/6/2016 or
31/5/2016 - 18/6/2016 or etc.
Should I choose the image pairs with minimal temporal acquisition separation?
Yes, since that is likely to have higher coherence due to less changes in scattering.