After step 11 ‘geocode the product’ can SNAP output a data file in plain text format for a selected band data? In the file there are should be 3 columns ( longitude, latitude, valueOfBandVariable ) and multiple rows of data point. For example ‘valueOfBandVariable’ can be LOSD:
I think we need a bit more context. What data are you using? What are you trying to achieve? What steps did you apply (obviously 10)?
If you are referring to a special workflow: Wouldn’t this question be more suitable in the corresponding thread?
Edit: I moved your other question in here as well. To me it doesn’t make sense to open new topics with such specific questions without any additional information. This forum deals with a quite large variety of data, applications and methods. So it is hard to guess from scratch what you are talking about.
At step 7 ‘remove topographic phase’ and step 11 ‘geocode the product’, ‘SRTM 3Sec ( Auto Download )’ is specified for ‘DEM’ parameter in the dialogue box. Does that mean the internet must be connected when SNAP is in processing? By my experience the result product is same whether the Wi-Fi is turned on or off. Where is the real DEM used?
You can export the data to text by several ways. First you should subset your product, so that it contains only the band you need.
Then you can simply go to File -> Export -> CSV. This will give you a text file.
You can also draw a shape on the image and then select from the view context menu “Export Mask Pixels” and select just drawn geometry from the upcoming dialog. This will give you also the pixel values as text, but only for those which are in the shape.
There is also a pixel extraction tool (Raster-> Export->Extract Pixel Values). Here you can export the pixels of specific pixels and on a stack of products.
That the result is the same is because the data has been already downloaded and is cached. It’s not downloaded every time again.
It’s located in you user home directory: <USER_HOME>\.snap\auxdata\dem
I still don’t get which steps you are referring to. Is there a list somewhere?
The steps are listed in the document ‘Interferometry Tutorial’ ( author is Luis Veci ) downloaded from your website.
thanks for clarification. Would be worth mentioning in the first post 
In the .cvs file I got for a geocoded image, the 1st column is still ‘featuredId’( not logitude ) and 2nd column is ‘unw_phase…:float’( not latitude ), no the 3rd column( I want ‘unw_phase…:float’ here ). How to export the data of a geocoded image to the plain text file in format I want?
This is not possible. The bands are exported in the order as they are defined in the product. So you could create a new product and copy all bands over. But I think this is not worth it.
Dear Marpet,
On my MacBook I have tried this many times: after opening a product with a band ‘Unw_Phase…HH’, click File->Export->CSV, then in the box give a name and tell SNAP to write to which folder, I get a file with ‘.csv’ extension. In this file the name of the 1st column of data is ‘featureID’ with integer value, the 2nd column is float values for another band in the product, and the 3rd column is float values of ‘Unw_Phase…HH’ band. I think I did nothing wrong, but can not get the plain text file I want: for all pixels in a band the 1st column is the longitude of the pixel, the 2nd column is the latitude of the pixel, and the 3rd column is the 'Unw_Phase…" at that pixel. Can you give me more help? Thank you!
Dear Marpet,
I also find another function: ‘Raster->Export->Extract Pixel Values’ in the SNAP on my MacBook. For the ‘Unw…HH’ band in a product, the dialogue box does not show the ‘Unw…HH’ in the title row but ‘Latitude Longitude DateTime’, and I can not add the column name I want. Also It looks I need an expression to convert the un-wrapped phase to LOSD, yet where are the wavelength and incident angles? It looks they are not stored in the product. I can not find the relative material in the online tutorials for these post-processing steps. Please help! Thank you!
I still don’t get why you want a csv file.
If you tick to the BEAM-DIMAP format during processing no metadata gets lost. There you will find incidence angle and wavelength.
The Pixel Extraction Tool is used to find pixel values for a list of coordinates. If I understand you correctly, that’s not what you are looking for.
You could write a script to reformat the csv file to look as you want it. Also, you could do a band subset and only select lat, lon, and Unw…HH, so you only have these three left (you’d still have to live with the featureid column when expoting to csv).
After clicking the ‘Unw…HH’ band in a geocoded product, it shows a color contour graph in another view box. I want to add lon-lat coordinate axis and legend to this graph then it can be pasted to a Word file for a report. Because I can not find how to do this in SNAP’s tutorial material and its help, I want to export the data of this graph in a plain text file ( lon, lat, UnW in each column ) that other software can read and plot what I desire. Can you help on
(1) how to add lon-lat coordinate axis and legend to a graph?
(2) if SNAP is still not able to do this, how to export the desired data of a graph to a plain text file?
Sorry for not declaring my problem clearly because I just enter this geoscience field and may use some words and terms not commonly used this field.
An additional question, after the InSAR processing how to convert the un-wrapped phase to LOS displacement? I do not know where the exact wavelength value is and where the incident angle values stored.
Thank you very much!
did you already import the unwrapped phase back into SNAP with the SNAPHU import?
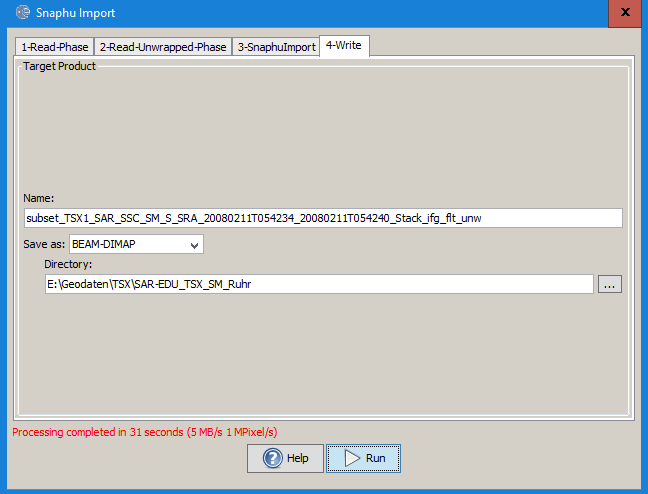
If not, please see here: Import Unwrapped result back into SNAP for terrain correction
For displaement you can use:
Radar > Interferometric > Products > Phase To Displacement
This should actually convert it into measurable units.
However, I wasn’t lucky with it so far and used another approach in band maths:
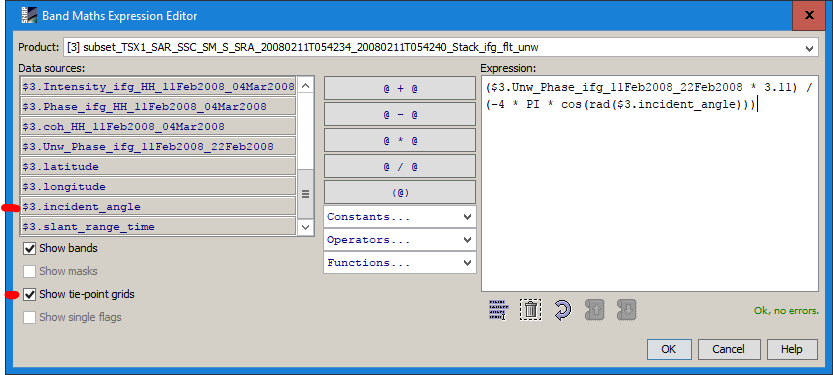
(Unw_Phase * wavelength in cm) / (-4 * PI * cos(rad(incident_angle)))
This gives you the relative change between two satellite images in centimeters Source: http://www.esa.int/esapub/tm/tm19/TM-19_ptA.pdf35, chapter 2.3.
The wavelength depends on what sensor you are using, the incidence angle can be used in the band maths ich you set the checkbox Show tie point grids:
Many questions on that have been answered here: Subsidence map in 3d view
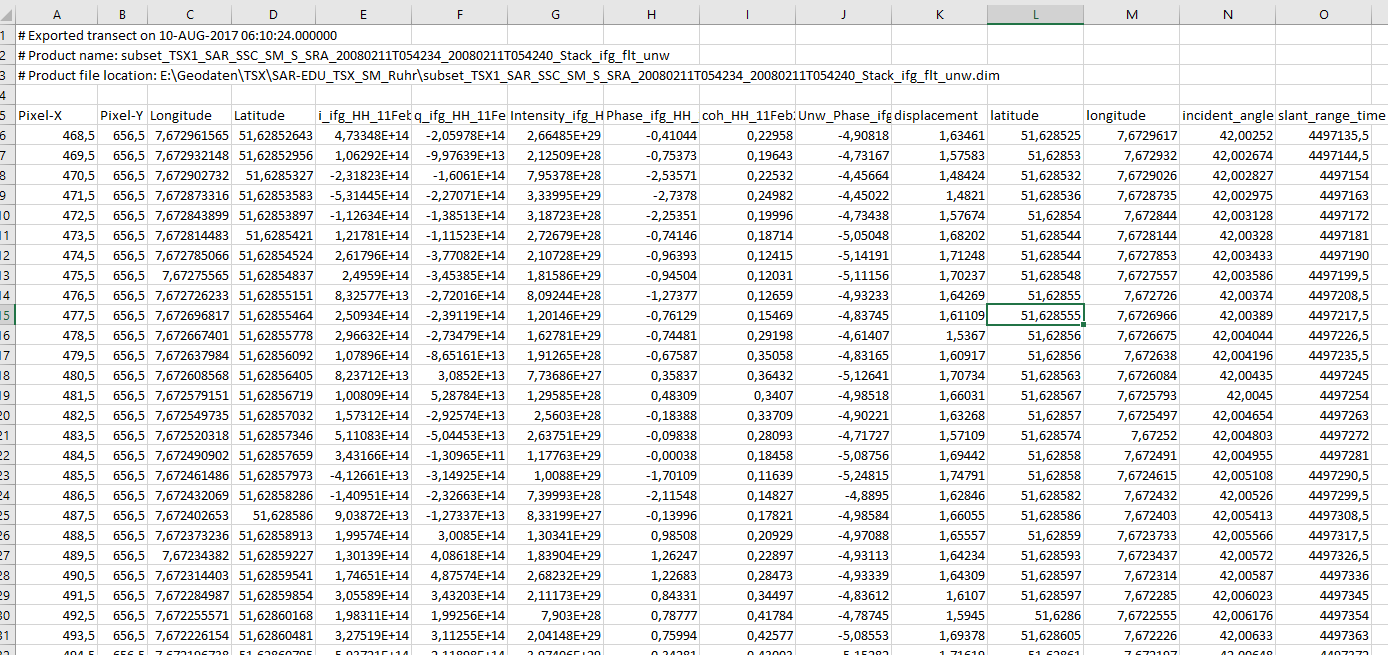
If you want to export raster values with lat/long coordinates, create a rectangle by digitizing it at the area of your interest, select it and right-click > export transect pixels:
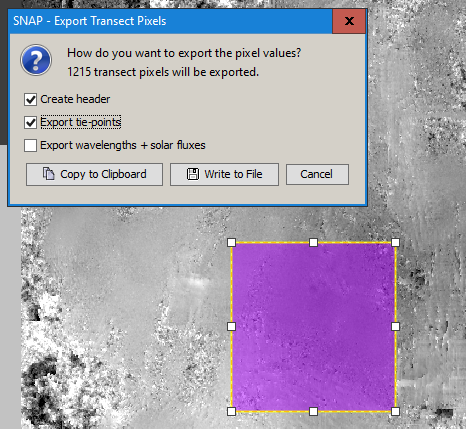
This allows you to write a txt file which you can easily open in Excel. If you select “export tie points” it contains la/lon bands.
1 Like
Hi, ABraun,
I think I have imported the un-wrapped phase to SNAP correctly, and menu item ‘Radar>Interferometric>Product>Phase to Displacement’ does not work as you said. Thank you for the help! Here are still questions:
(1) In the picture of your ‘Band Maths Expression Editor’ window, in the ‘Expression’ box I think ‘3.11’ is the ‘wavelength in cm’. Where does you find this value? In the page of ‘Properties’ of my items( right click the product or band name ) no wavelength shown, even after opening the original downloaded image package.
(2) In my ‘Band Maths Expression Editor’ window, in the ‘Data source’ box there is no ‘incident_angle’ band shown as that in your picture. I think it should be somewhere in the product to be used in later processing. Where can I find it?
(3) I think ‘digitizing it at the area of your interest’ means selecting a subset for the interest area on the image. But ‘right-click’ on a subset or on a whole image, the item ‘Export Transect Pixels’ in the menu is always disabled( grayed ). What is wrong here?
Thank you very much!
Hi, ABraun,
I just find what ‘create a rectangle …’ means: draw the ‘purple’ rectangle by the drawing tools as shown in your picture. Yet after clicking ‘Export Transect Pixels’ it always shows an error ‘There is no transect defined in the selected band.’ What is wrong?
Thank you!
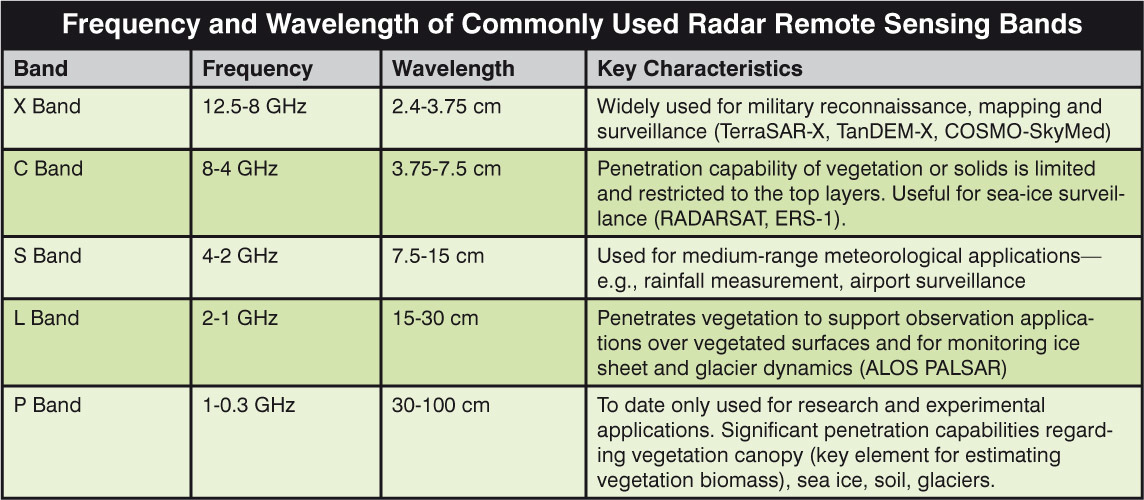
each sensor’s wavelength can be retrieved via Google as well, use this as an orientation:
Regarding the incident_angle grid - did you check the box with tie-point-grids as I indicated with the red marks? If you imported and processed your SAR dara correctly, the should have been preserved in the product.
For digitizing vectors, note two things. First, you can save your product after digitization (File > save product) to make sure the changes are applied. Second, you have to select the digitized box with your normal mouse cursor (not the digitizing cursor) so it is marked with a yellow frame and white squares as in my example.
(1) Thank you for the table about the wavelength! Since each band is a range of frequency, the real frequency for a particular image data I downloaded should be stored somewhere in the package. Can you give me a hint how to get it? Picking up a value of frequency in the range will have the processing result not accurate enough.
(2) I find why there is no ‘incident_angle’ data in the ‘Data sources’ box when doing ‘Band Maths’: when I did ‘Radar>Ceometric>Terrain Correction>Range-Doppler Terrain Correction’ I did not check the box of ‘Local incidence angle’ and ‘Projected local incident angle’. Yet another 2 questions: (a) which angle( ‘local’ or ‘projected local’ ) should I use for ‘Band Maths’( any difference between an ‘incident’ angle and an ‘incidence’ angle )? (b) There is no ‘incident_angle’ data in the ‘Tie-Point Grids’ folder but ‘localIncidenceAngle’ and ‘projectedLocalIncidenceAngle’ in the ‘Bands’ folder. Is their data structure compatible?
(3) After drawing a rectangle on the image, how to remove it? There is no such an icon in the tool bar to do this.
Thank you very much!
you still didn’t tell us what sensor you are using  Would help us to help you.
Yes, you can derive the exact wavelength from the frequency of your sensor
http://www.wavelengthcalculator.com/
- I find why there is no ‘incident_angle’ data in the ‘Data sources’ box when doing ‘Band Maths’: when I did ‘Radar>Ceometric>Terrain Correction>Range-Doppler Terrain Correction’ I did not check the box of ‘Local incidence angle’ and ‘Projected local incident angle’. Yet another 2 questions: (a) which angle( ‘local’ or ‘projected local’ ) should I use for ‘Band Maths’( any difference between an ‘incident’ angle and an ‘incidence’ angle )? (b) There is no ‘incident_angle’ data in the ‘Tie-Point Grids’ folder but ‘localIncidenceAngle’ and ‘projectedLocalIncidenceAngle’ in the ‘Bands’ folder. Is their data structure compatible?
Don’t apply Terrain Correction before the very last step. You don’t need your data in real geometries before and as you say, you lose much information. You can later terrain correct your displacement image. For the calculation of displacement, the global incidence angle (without topography) is used. You need the local incidence angeles (with topography) for other things, calibration for example. So those of the TC module don’t actually matter to you.
(3) After drawing a rectangle on the image, how to remove it? There is no such an icon in the tool bar to do this.
Just select it with the white mouse and hit the delete button of your keyboard.