Thank you for the response! Since I have many of image set downloaded, I think it is not polite to ask you to calculate or find the wavelength of each of them for me, but to know how to calculate it myself or where it is stored in the downloaded package for each sensor( ‘type’ of images ). For example the ‘type’ of my images includes ALOS1CEOS, ALOS PALSAR, TSX, RADARset2 and S1A, I can not know the exact wavelength from their property page, how to find it or calculate it by some other parameters in the package?
you can search the metadata for names, such as frequency, for example.
If you search the Sentinel-1 metdatata for radar_frequency you get the following entry:
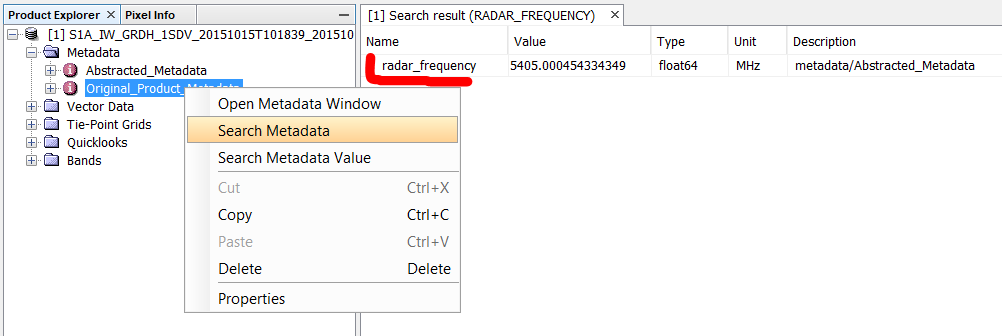
If you enter that into the calculator I posted above you’ll get 0.05550416 m or 5.550416 cm

Sentinel-1 is C-band so this totally matches the values in the table given above.
You can do this as well with all the other satellites.
Thank you for the method of finding wavelength! Another problem: When selecting a subset from an S1A image ( it is so large, ~8GB ) it says “The functionality you have chosen is not supported for products with bands of different size. … Do you want to resample the product now?” After I clicking ‘Yes’ button and using the default parameters it says “SNAP-Error: Type: OperationException, Message: Cannot construct DataBuffer.”
(1) It looks the buffer is not large enough. Since my MacBook has 16GB RAM and more than 250GB free space, what is wrong in SNAP?
(2) As I checked on all recent S1A images downloaded, each has 6 bands of data and three( IW1, IW2 and IW3 ) 2 of them are in same size( one VH and one VV ). I do not know what role each band of data is in the processing( may get more precise result? ), yet I think using one VH and one VV should be OK, right?
So I want to delete other 4 bands, any potential problems after doing this?
you cannot make a subset out of a SLC product as it is acquired in stripes (bursts)
You first have to deburst your data before the subset or just download the corresponding GRD product instead of SLC. It is smaller in file size and already debursted. You can’t use GRDs for interferometry however.
Follow the “TOPS Interferometry Tutorial” I have done interferometry for 2 S1A-TOPS images. Since the size of image file is large that needs long processing time and I want to do for more files, I try to use graph builder. Yet the menu-item( operator ) ‘S1 TOPS Coregistration’ can not be selected but 3 sub-menu-items. I think “Double-Difference-Interferogram” is what I want. Unfortunately it shows a red error message “split product is expected”. What does this mean? How to split an image for doing interferometry?
Thank you for the help!
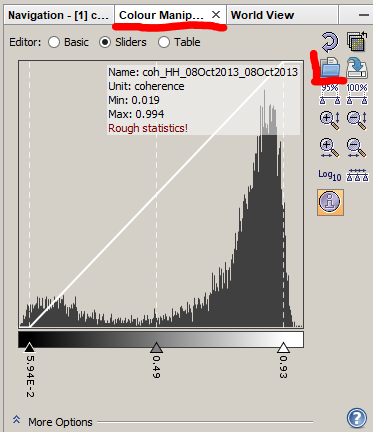
Follow the “TOPS Interferometry Tutorial” I have done interferometry for 2 S1A-TOPS images( date difference is 12 days ) . Then follow the step 8 to step 11 in the “Interferometry Tutorial” I have got LOS displacement. Then I have used “BandMath” with ‘incident angle’ convert the LOS displacement to the real displacement. Yet image of it automatically becomes in different gray levels, not in color. How to make it in color again?
using the color manipulation tab. You can import and apply any color scheme you want.
Hi, ABRaun,
I did not export “raster values with lat/long coordinates” into a plain text file for a while, and now have problem to do it. After drawing a rectangle on the image of geocoded un-wrapped phase, sometimes it shows a purple rectangle with 6 place holders around it yet sometimes it only shows yellow rectangle without place holder. If the later case it says “Transect pixels cannot be exported: There is no transect defined in the selected band.” Can you help where is the problem? Since I just patched 5 updates of SNAP, is the problem related?
Thank you!
Ning.
hard to understand, sorry.
Maybe you can support your issue with screenshots.
1 Like
The page in the help system might give you some hints how the geometries are handled.
Have a look at Vector Data Management.
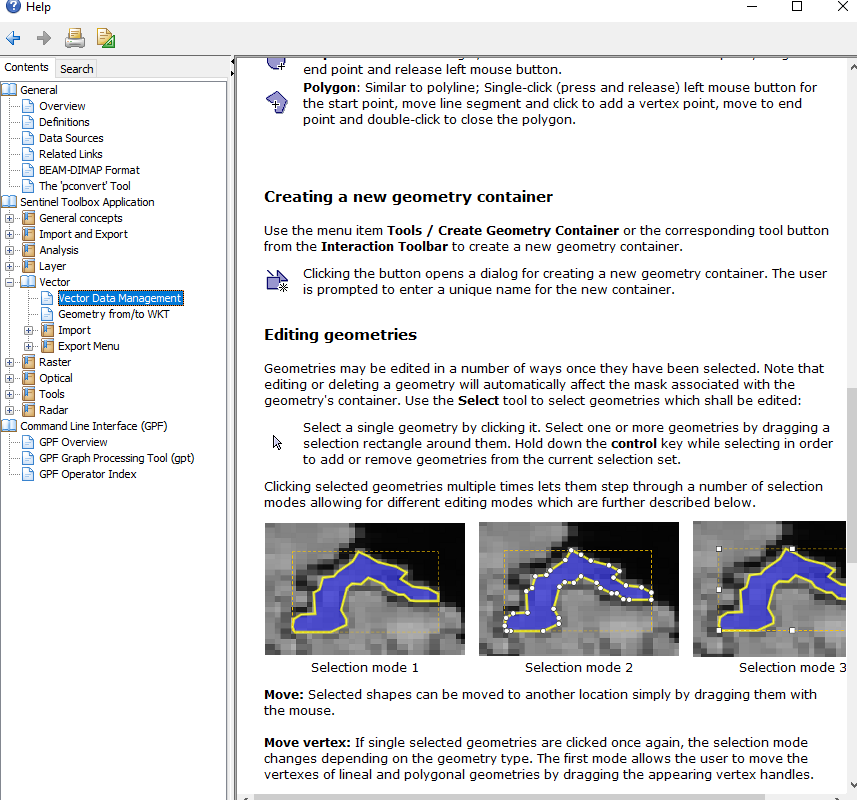
If it is said that there is no transect then probably because no geometry is selected. The message is a bit misleading here.
Just use the selection tool ![]() and click on it. Then the geometry will get a yellow border.
and click on it. Then the geometry will get a yellow border.
Thank you very much! I can export the data after selecting the rectangle now. One more question: is there an option that a whole line of data with NaN value will not be exported? As shown in the help page in your reply to me, drawing an irregular shape is relatively difficult to operate, so I think this option is useful.
No this is not possible. This must be done manually in the text file.
But it can be an idea for further improvements.
Thank you for the information! When the rectangle of selection covers the whole image( in a non-rectangular shape ) with some small background area, the transected data will have many value as NaN( for example, 25,000 of 30,000 data is NaN ). Anything else needs to be done correctly to avoid this problem?
You can draw a non-rectangular shape and follow the border of the image data.
I wonder what is the use of having a transect around the border of the image.
Can you illustrate this a bit? Maybe with a screenshot.
I wish the function of adding lat/long coordinate axis and legend to a contour plot of a band data( such as the un-wrapped phase( LOS displacement ) ) can be “an idea for further improvement”. Currently I have to do it by a plotting software outside SNAP after exporting band data to a plain text file. Then the plot can be pasted into a document as a report to someone. Yet for a map with peninsula and islands it is difficult to draw a close polygon without river and sea area included. Since the data in the water or background area will be exported as NaN to denote that there is no data here, it looks much more data got NaN value( not its real value ) exported. Also manually deleting the NaN in the exported text file is a tedious work.
I am sorry that I do not how to attach a snapshot picture to this massage. I paste a picture file but can not see an icon or itself here.
you can post screenshots by simply pressing ctrl+v
Yes, it might be a good idea to allow users to exclude certain pixels from the transect export. Maybe not only based on NaN value but by expression. Might be more flexible.
Regarding the lat/long coordinate axis. Yes, this might be helpful and we have it already on the development plan. At the Moment we only have the graticule. It is only a poor replacement.
You can attache images by CTRL+V or by Drag 'n Drop or by using this icon: ![]()
Hi, Marpet,
I got a big problem when checking on the exported data. First I draw a small rectangle on a vertical displacement image in SNAP window, and export the data to a plain text file. By TecPlot software I plot the contour graph of the vertical displacement with the Lon/Lat coordinates( file 2u…7a.tif ).

Then ( not scale the image in the window ) I remove that small rectangle and draw a larger one which covers the area of the small one, and I plot the contour graph of the vertical displacement with the Lan/Lat coordinates again( file 2u…8a.tif ).

Compare these 2 graphs the patterns at the same Lon/Lat coordinates position are not same. So the exported data looks not correct.
Another problem: when the rectangle is larger to some extent, most of displacement data exported are ‘NaN’ values and they do not include the data points in a small rectangle in the larger one. How to avoid this?
Thank you for the help!
Ning.
I’m afraid I can’t really follow.
Could you also show screenshots of the rectangles within SNAP, please?
Maybe also attach the text files, if not too big. I can tell you also a location where you can upload them.
Here I don’t know anymore what’s going on at all. Sorry 
Hi, Peters,
I want to describe the problem by snapshots and pictures I draw with the exported data. Now I know how to attach a picture to this message( just ‘copy’ and ‘paste’ ), but if do this for a data file in plain text format this message will become un-readable since the data file is big( 60KB ). So please tell me where to send 2 data files to you along with the pictures and message.
Thank you for the help!
Ning.