I have been trying for a long time with graph builder with no success. I tried to read an image and calculate the NDVI and write it but an error appears “Unable to find band that could be used as red input band” and the box to select the bands in DVI tab is empty. I tried with Sentinel-2 L1C and L2A products, with full product or single tiles, with .xml and single jp2 bands, and no way. I also tried to reinstall Anaconda and SNAP but it didn’t work neither. This same process works without problems using the command window, but I would like to do batch processing based on a simple processing graph like that.
Yes this is a problem with the graph builder. It’s not supporting all the GUIs of all operators.
But you can easily create a graph xml file without the builder or even easier just create the graph without configuring it. Only add the operators and connect them.
Then save the graph to disk and do the configuration in the xml file.
This file can be used as usual on the command line.
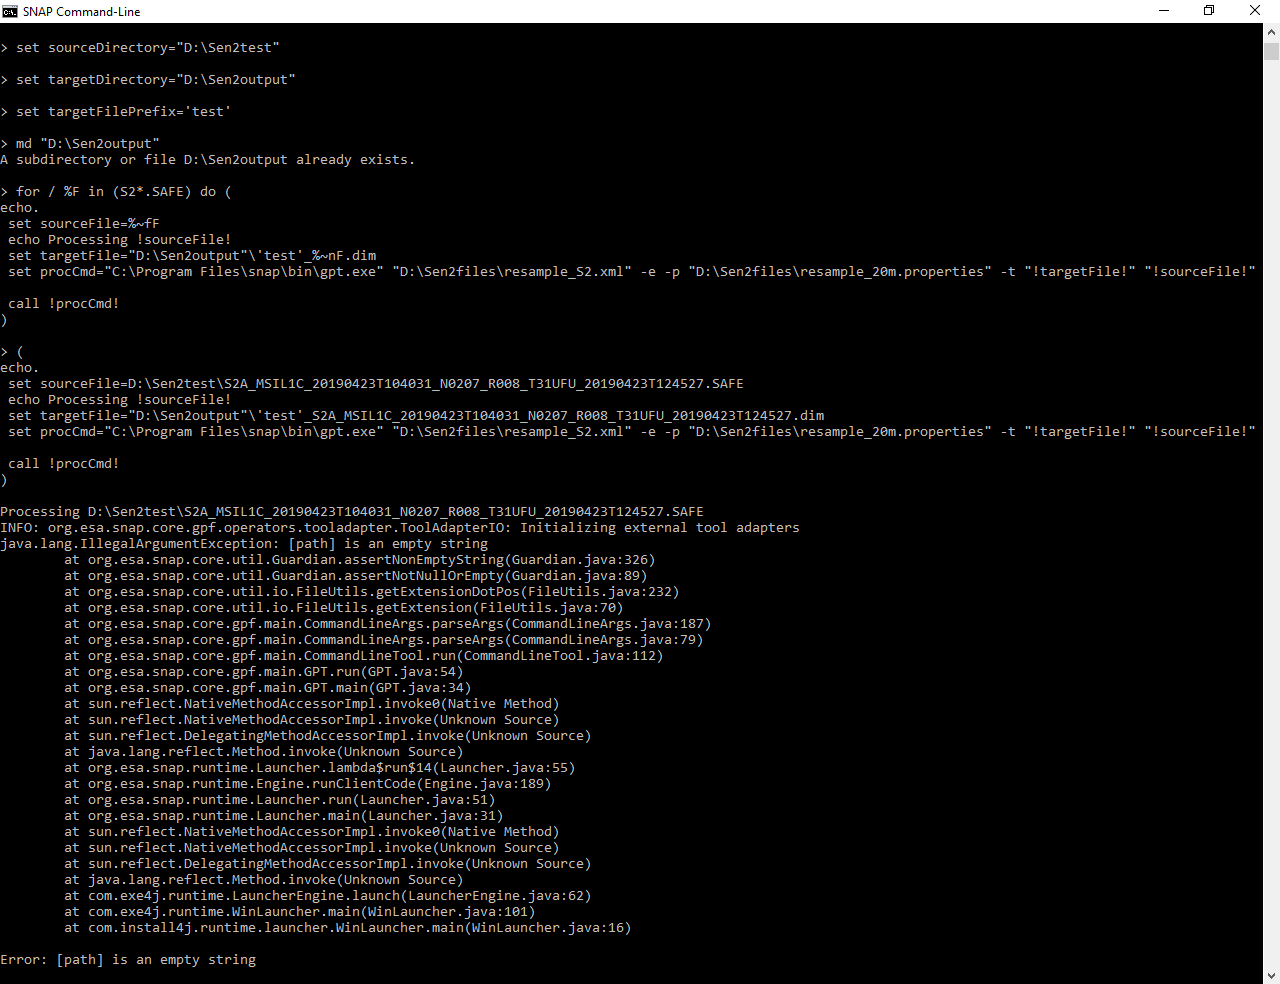
I am trying to process multiple level-1C images into level-2A images using Sen2Cor. As I have not had any success with the regular graphBuilder, also I have been trying to do it in Command Prompt. To do so, I have followed the tutorial with the same files provided, but after running for a few seconds, an error “java.lang.IllegalArgumentException: [path] is an empty string” shows up. How can this issue be resolved?