I am trying to measure glacier velocity using S1A-IW GRD data (single pass) by offset tracking method. I have some questions regarding to use offset tracking method which are below:
Which DEM format (like GeoTiff etc.) should I use in case of external DEM?
After DEM assist Coregistration is there any filter should I need to apply before/after offset tracking?
I want to measure the velocity for 2015-2016, in that case how can I make the time series for all the velocity output image of offset tracking during that period.
In SANP which offset tracking is use intensity or coherence?
In addition, it will helpful for me if anyone suggest his/her snap toolbox workflow for the offset tracking method based glacier velocity measurement.
Thanks for your suggestion. I got the following error when I used DEM in WGS84 format “java.imageio.iioexception:32 bit sample are not supported for horizontal differencing predictor”. Kindly help me about this. In addition, could you please suggest me a snap toolbox workflow for offset tracking method based glacier velocity measurement.
Its work now, I converted my DEM float32 to byte using gdal. Could you please help me to find a way for my third question “3.I want to measure the velocity for 2015-2016, in that case how can I make the time series for all the velocity output image of offset tracking during that period”. Thanks for the help.
I would personally acquire data at regular intervals, e.g. 36 days. So this should be around 10 for a year.
Then you calculate the offset for
1-2
2-3
3-4
…and so on
Then you have ten offset rasters which may show you the movements per 36 day cycles. You can then calculate a mean out of all using the Stack Averaging tool.
Thank you very much for your answer. I tried to calculate the mean velocity following this workflow “GRD data > Apply Orbit File > DEM assisted co-registration > Offset Tracking” and then I created 10 images for one year. After that I follow “create stack (stack all the 10 images) > stack averaging” but I got the error which attached with post.
I tried to find details about "Stack Averaging tool’ in snap forum but could not find details. Could you please help me in this regards.
I didn’t think stacking is work. How about the collocation option. If I make like this ‘b1+b2=b12’>‘b12+3=b123’>‘b123+b4=b1234’>'b1234/days of b1234", does it sounds fine? Please help me.
Stacking only works if all of your images are in the same geometry because your data is not projected to a coordinate system yet. But as you chose different masters for your interferometric pairs, they cannot simply be stacked or collocated. Make RGB images to see if their contents match.
I would perform Range Doppler Terrain Correction on all displacement maps first and stack then.
According to your suggestion, I did Range Doppler Correction and then stack all the images. After that using Band math calculate the mean velocity. The workflow is like that:
GRD Data
2.Apply Orbit
3.DEM Assisted Co-registration
4.Offset Tracking
Apply Range Doppler Correction for all the offset tracking velocity output.
6.Stacking.
Use Band Math to calculate the mean. (If 4 offset tracking velocity images , then add all the image and divided by 4).
Please tell me is this workflow is fine or should I need to do anything?
Have you stacked the data after RD TC? I would technically do it like you proposted but it is hard to tell if everything is alright when I don’t see the intermediate products. This is rather your responsibility to see if the results are
Thanks for the quick response. Yap I did the stacking but forgot to write in previous message. Results seems fine for me. Need to spend more time on it. If any issue I will ask you question through this post. Many thanks again.
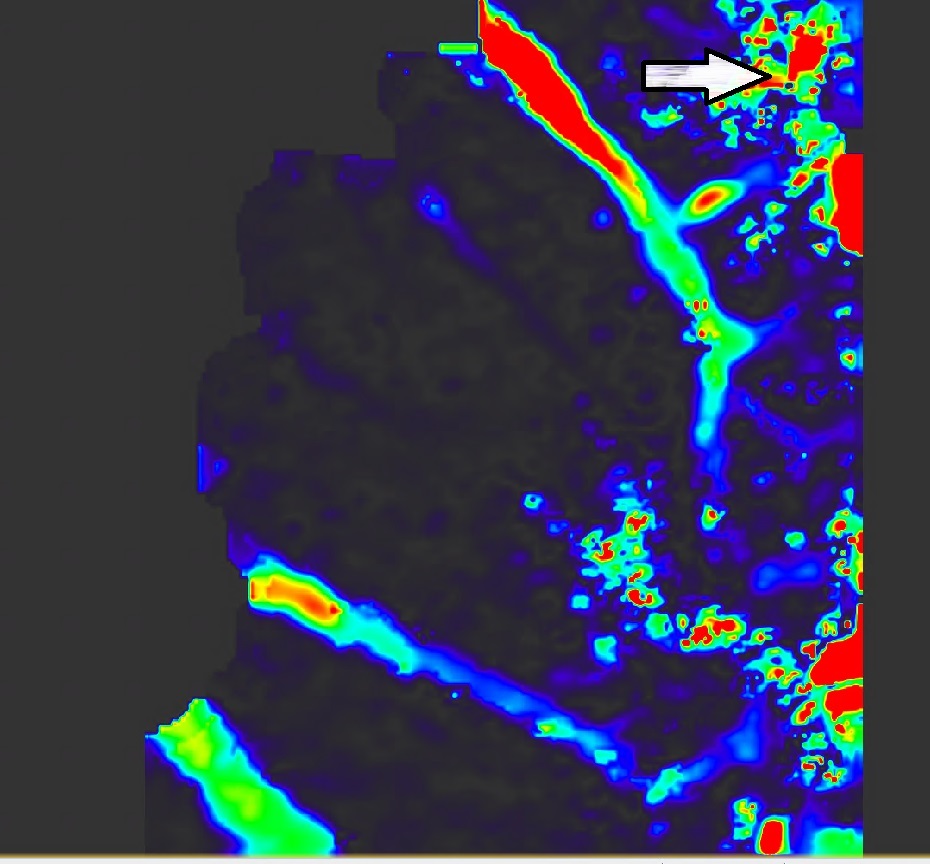
I faced the problem when I select 24 days interval for glacier velocity estimation. I attached both 12 days and 24 days interval velocity? 24 days velocity is not spatially smooth, do you have any suggestion in this regard? In addition, 12 days image also have some discrete pattern (indicated by arrow mark) in some areas (which I think error in velocity over the image), could you please tell me how to get spatially smooth velocity.
After generating the desired output , its resolution can be changed through the range doppler terrain correction,If I am not wrong?
I am applying the correction after generating the velocity output. I want the output in point format which i am doing through arcgis but its showing error in size? when checked the size in arcgis raster metadata it is in 8.93e-005. Can anyone help me with this?
I did the same process to estimate the glacier velocity. I applied the different window size for the Image of 12 days interval. I can not get the adequate pattern of velocity within a glacier. Could you check my result and suggest any idea to improve the results. Here is the my result: