Hi!
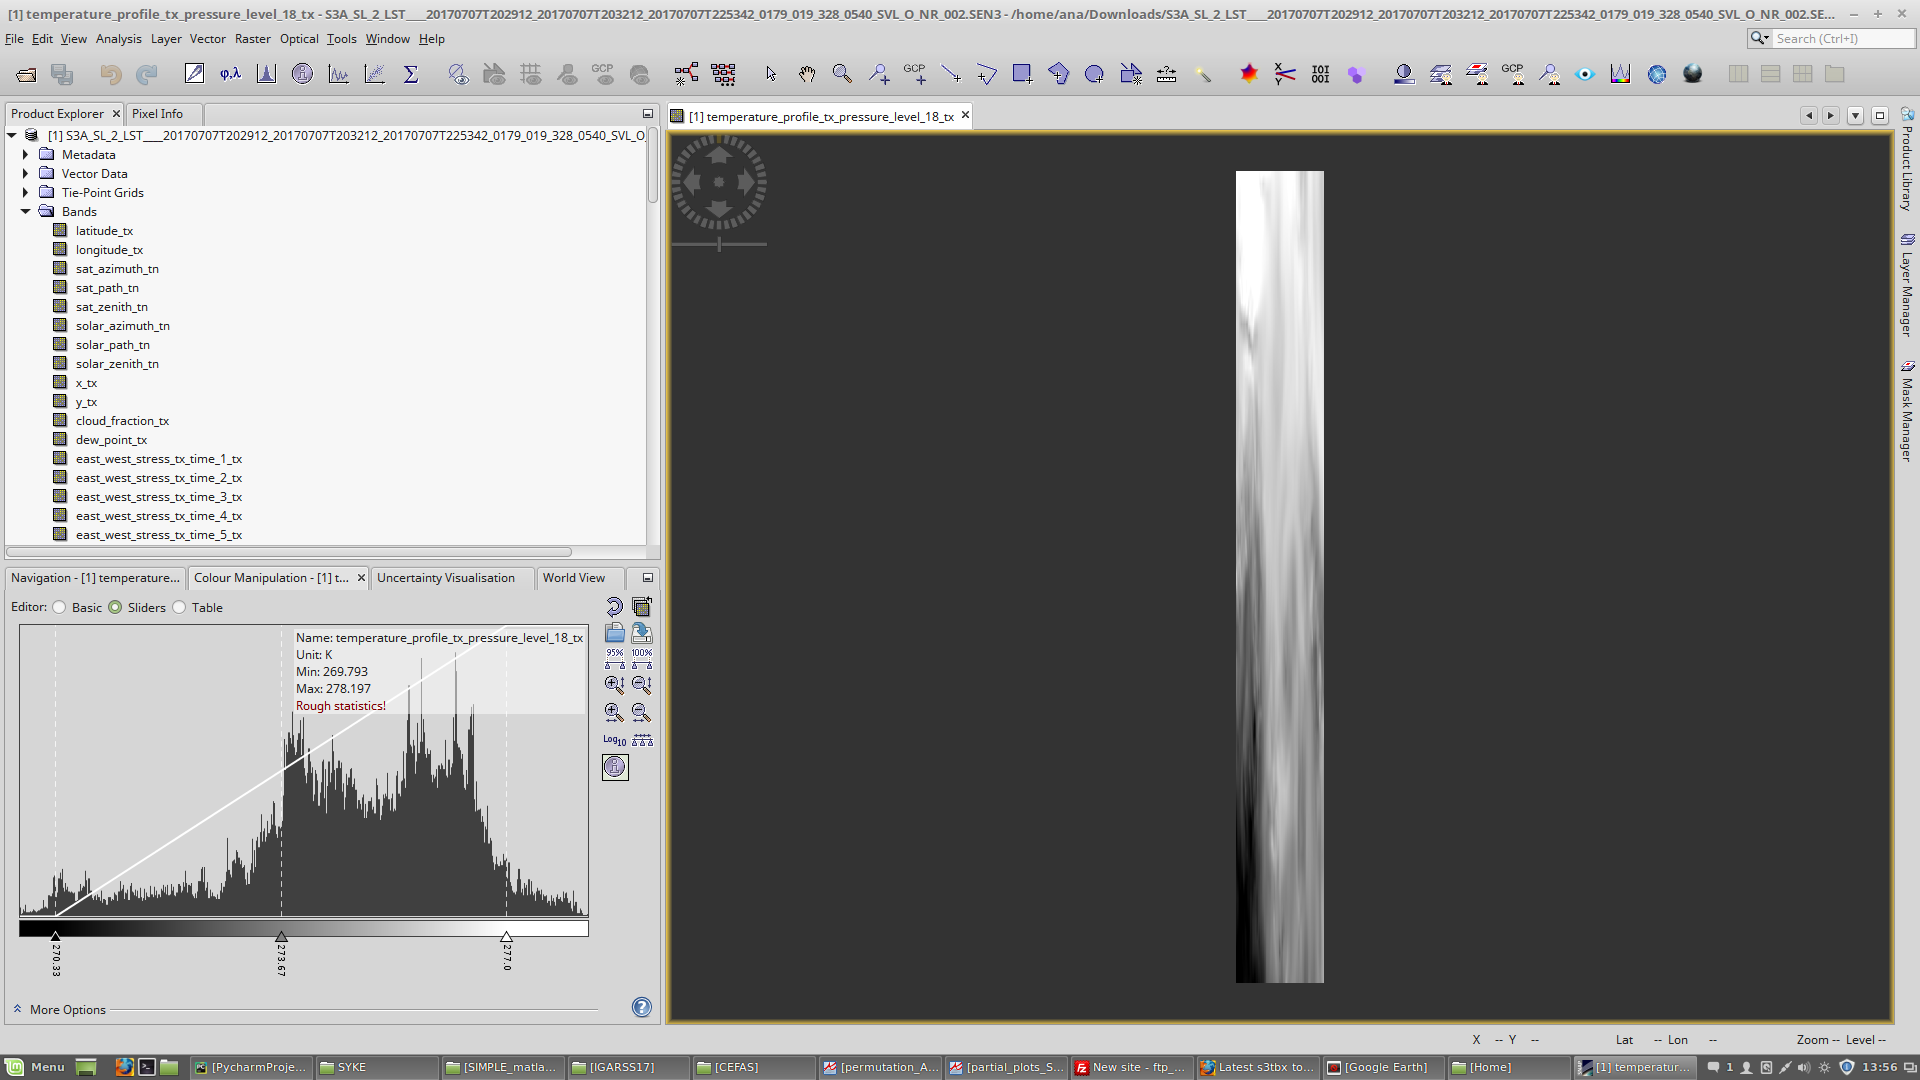
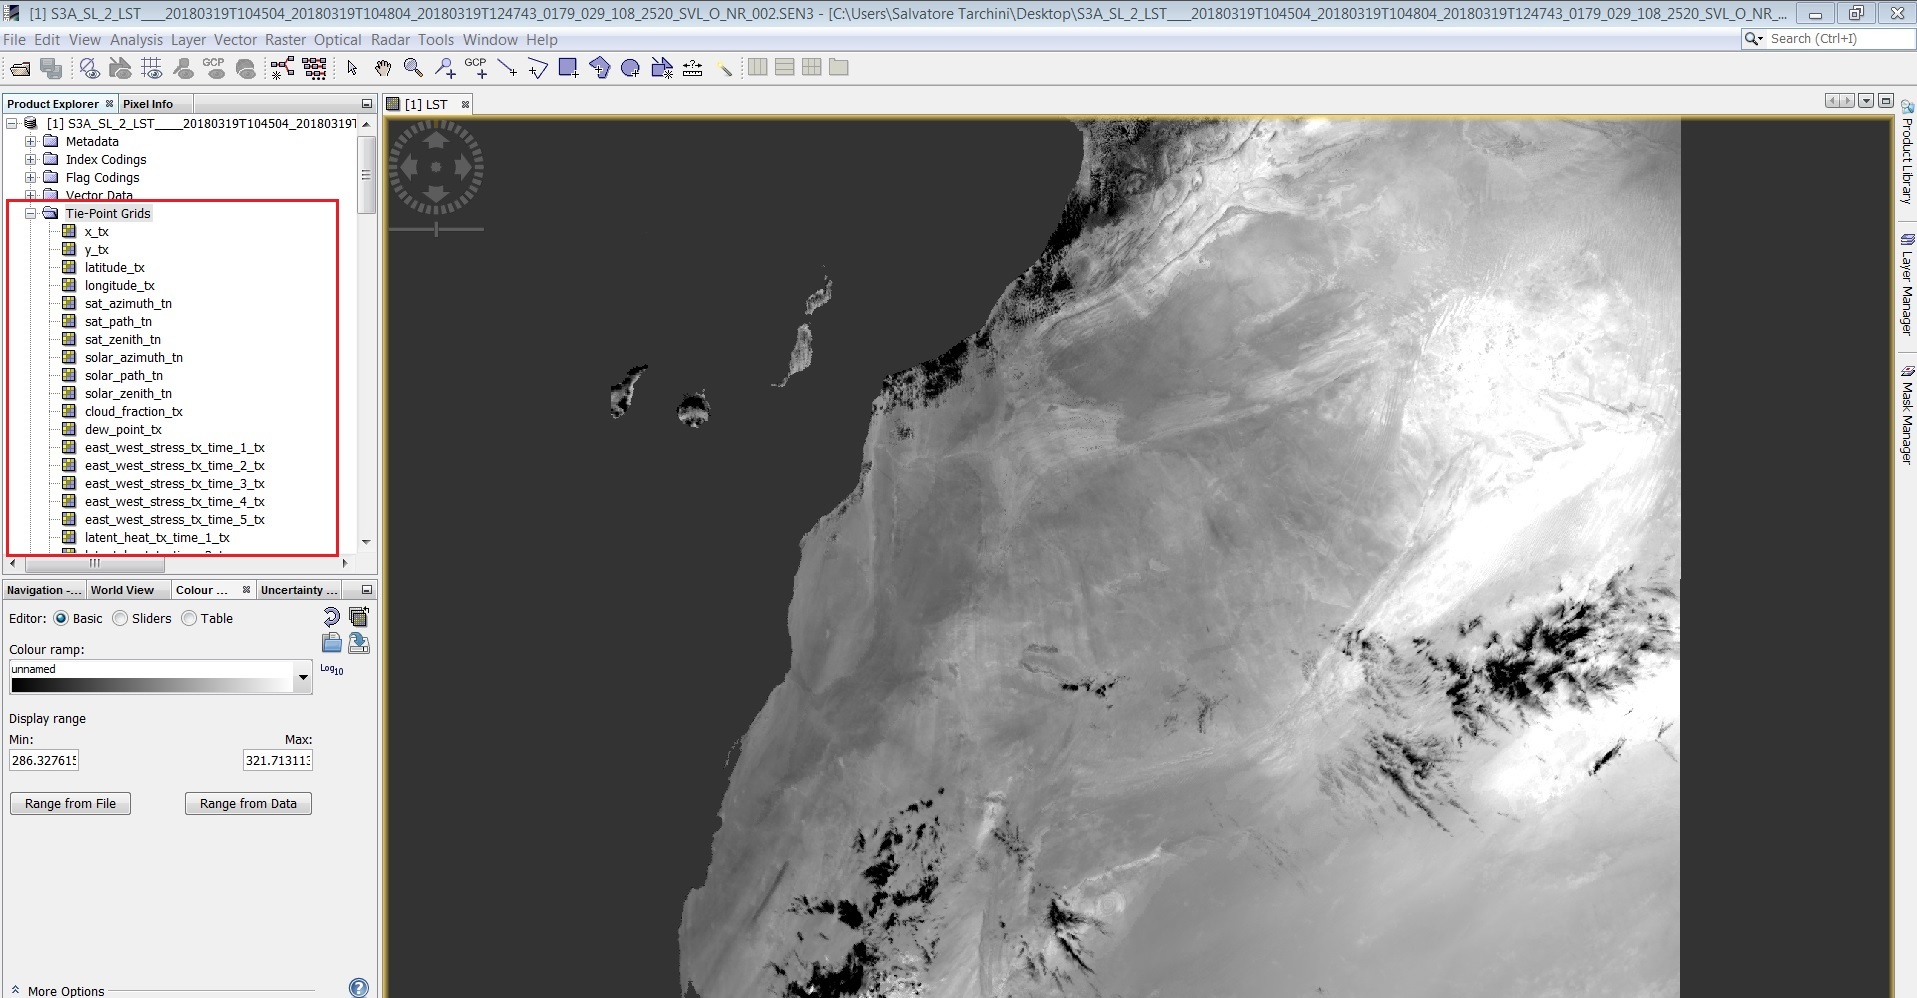
I have been trying to read S3A-LST products with my SNAP v5 for Linux. Something is wrong when reading the manifest.xml. I think is reading the Tie-Point grids as bands. The scene is read without problems in mac and windows. Ideas? Thanks! See image below:
Hey Ana!
I’ve just tried with the same product in my Ubuntu VM.
It looks good. I’ve tested with another product too.
All updates installed? I assume you did, but …
Hi,
I have the same problem with the same product type. Moreover the same product opened with the same version of SNAP (5.0) on a windows OS based laptop looks good. Basically the product opened on my linux VM doesn’t show the measurement data: LST, NDVI and so on are supposed to be showed under “bands” but they are missing. Masks are missing too and the product footprint isn’t successfully read: indeed the product cannot be seen on the World view and functions such as mosaicing and reprojection don’t work.
Maybe is there any configuration to set in order to correctly read the product manifest?
Thanks a lot!
Salvatore.
Maybe you try with the latest SNAP version. Also which specific product are you using? Can you post the name?
Ok I will update the software. The product is S3A_SL_2_LST____20180226T094257_20180226T094557_20180226T115130_0179_028_193_2160_SVL_O_NR_002.SEN3
Thank you,
Salvatore.
Hi! I’m having exactly the same problem…also with the latest ubuntu and the S3 type of products. SNAP is already the latest version. Did you solve it?
Thanks a lot 
Hi @anandreum, @marpet,
Unfortunately I didn’t solve the problem. I have updated SNAP at the last version on my ubuntu Virtual Machine nevertheless the issue persists. Moreover I have realized some other strange things that could be useful to know.
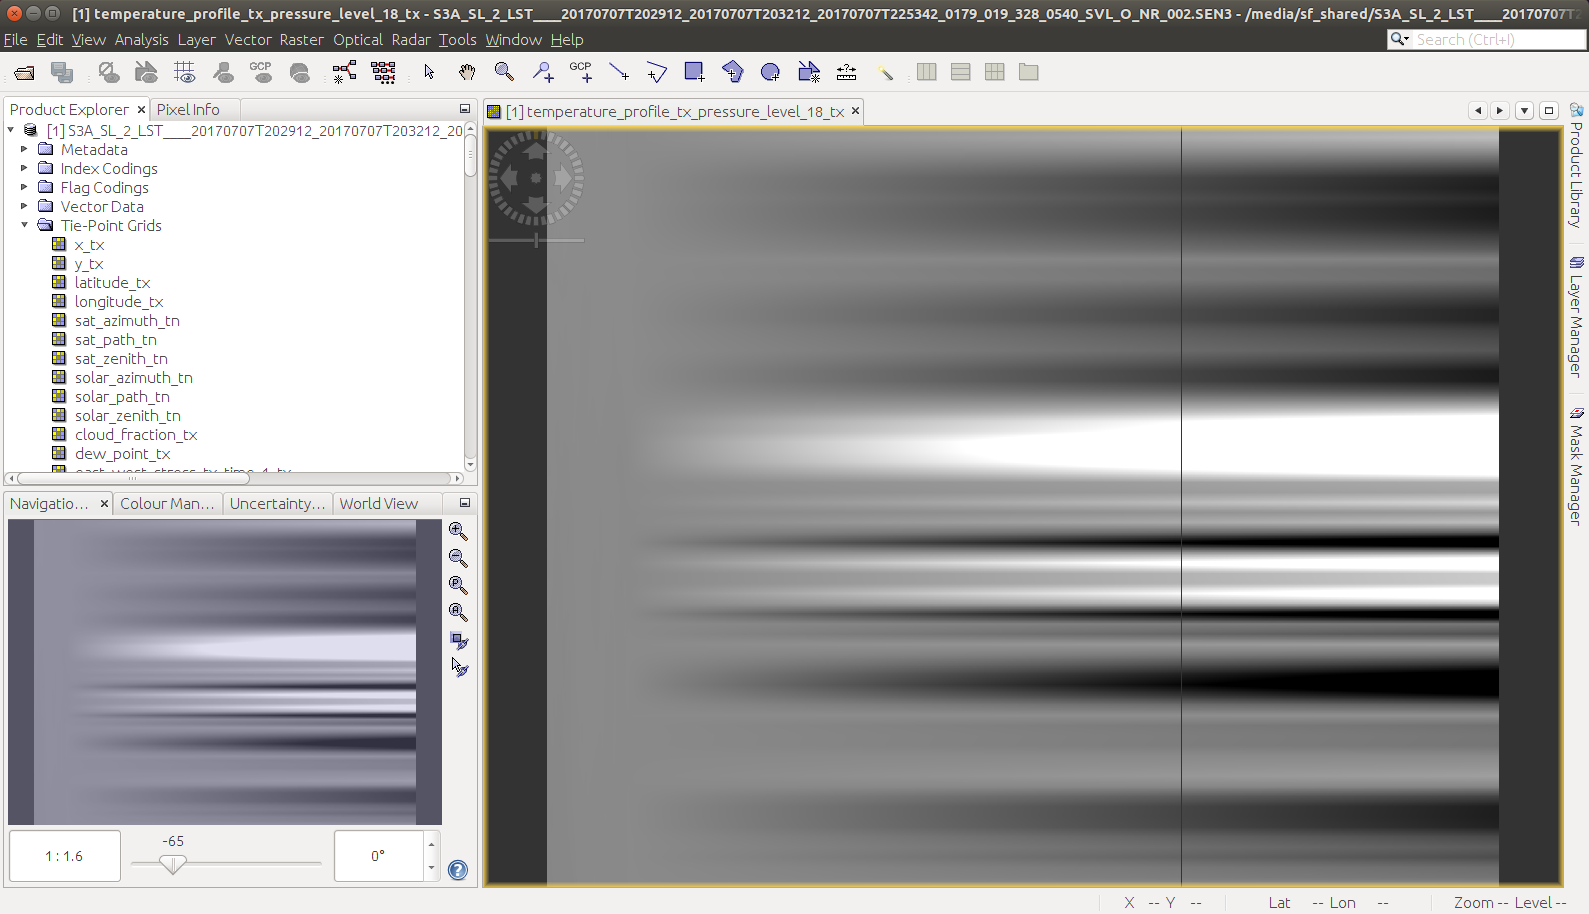
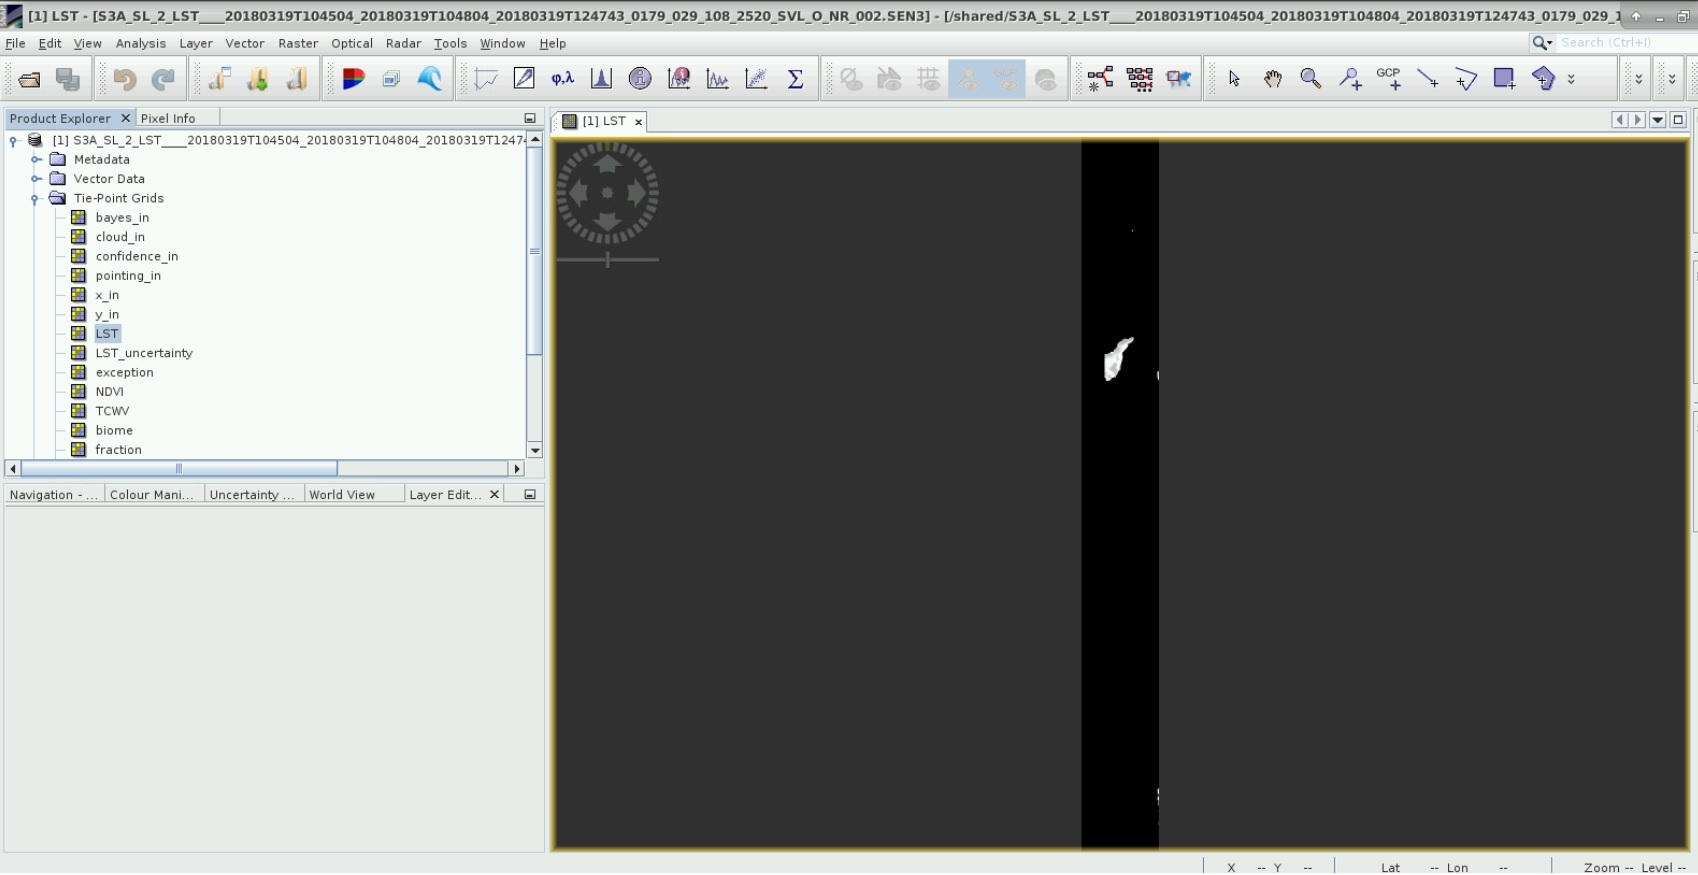
The screen below shows an SL_2_LST product (acquired today) opened in SNAP 6.0 on Ubuntu. The land surface temperature (LST) should be under Bands but it is under Tie-Point Grids. The same assumption is valid for the other data such as NDVI, TCWV etc. Moreover as reported by @abruescas the showed scene is narrower than expected.
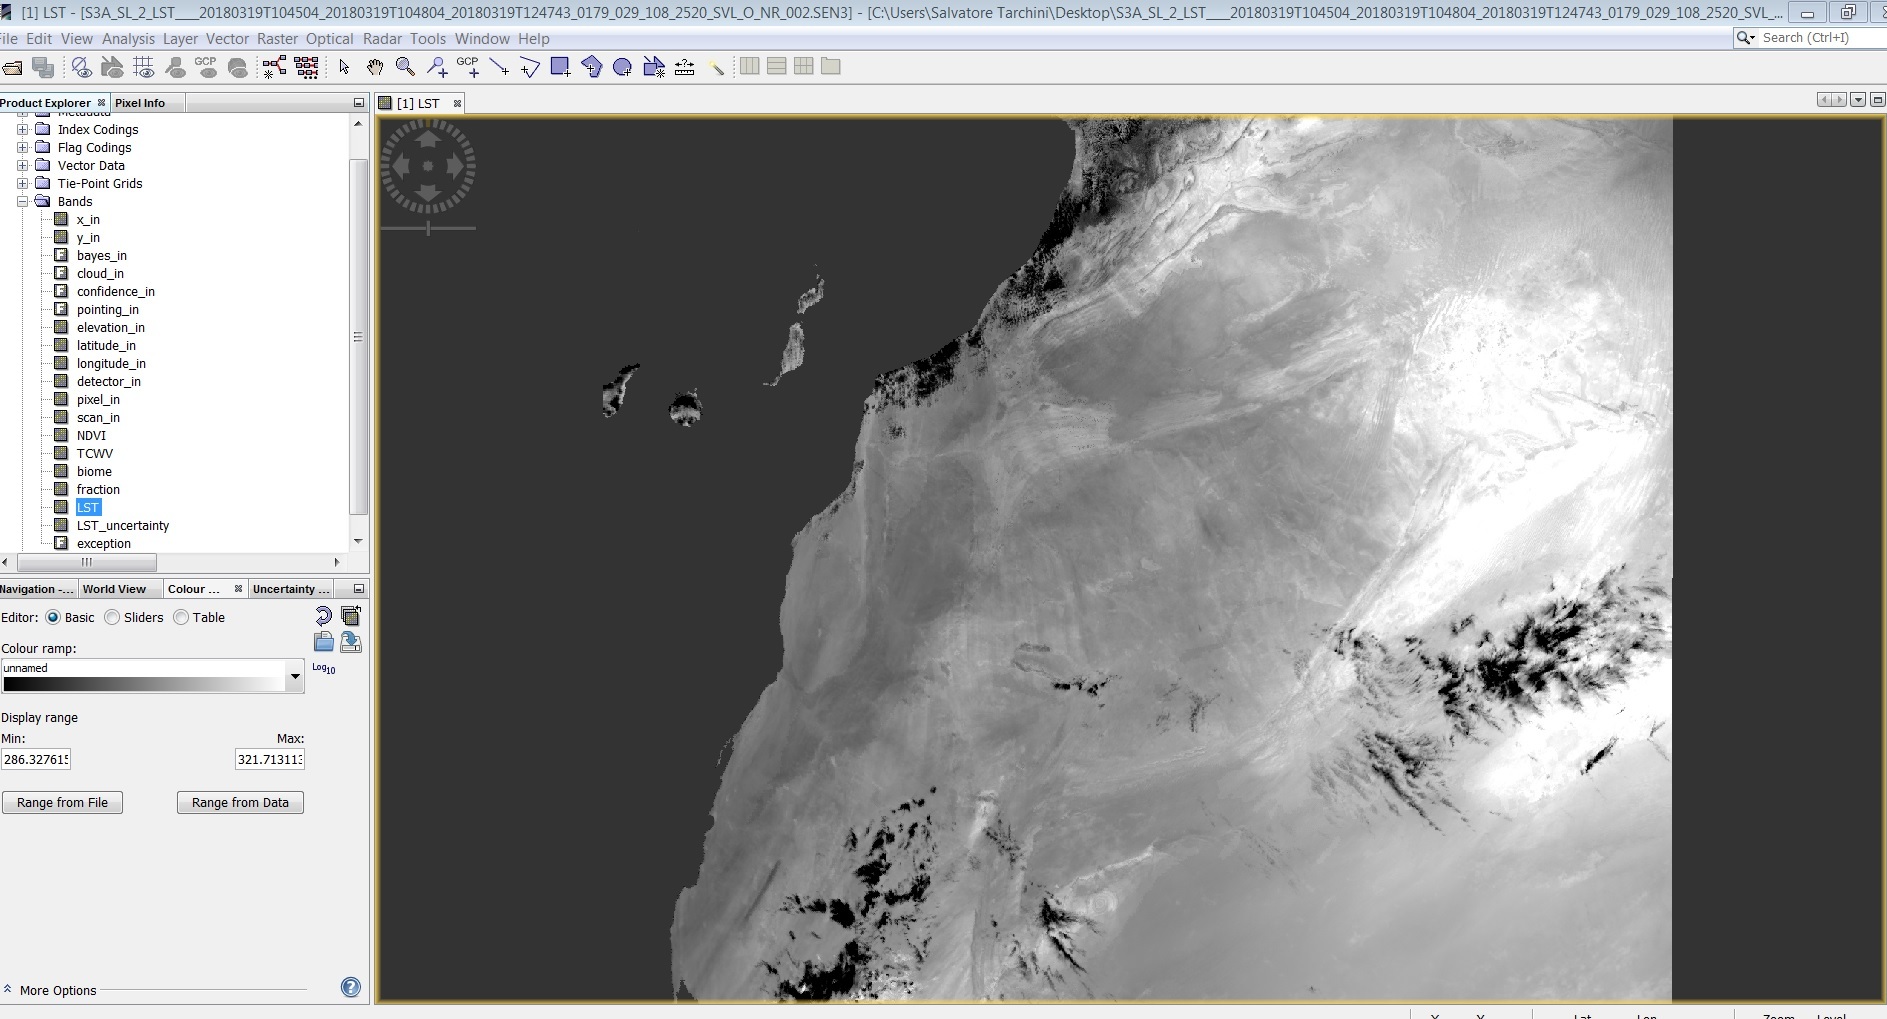
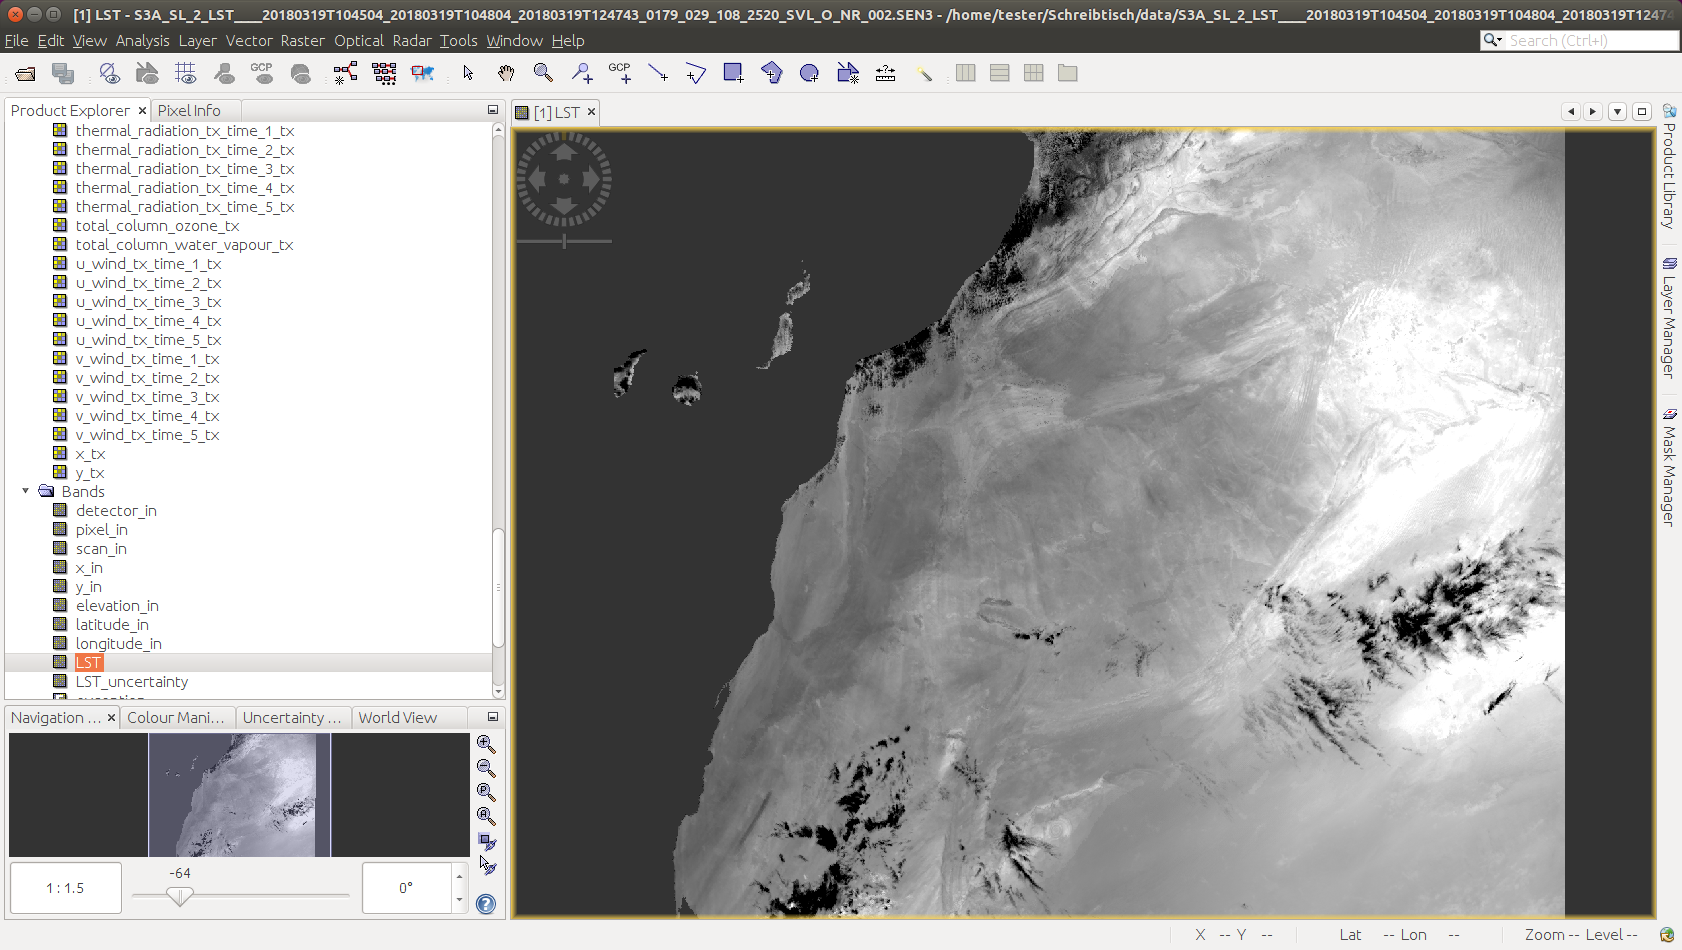
On the contrary here below there is the same product opened with SNAP on Windows OS. LST and the other data are correctly listed under Bands and the covered scene is the expected one.
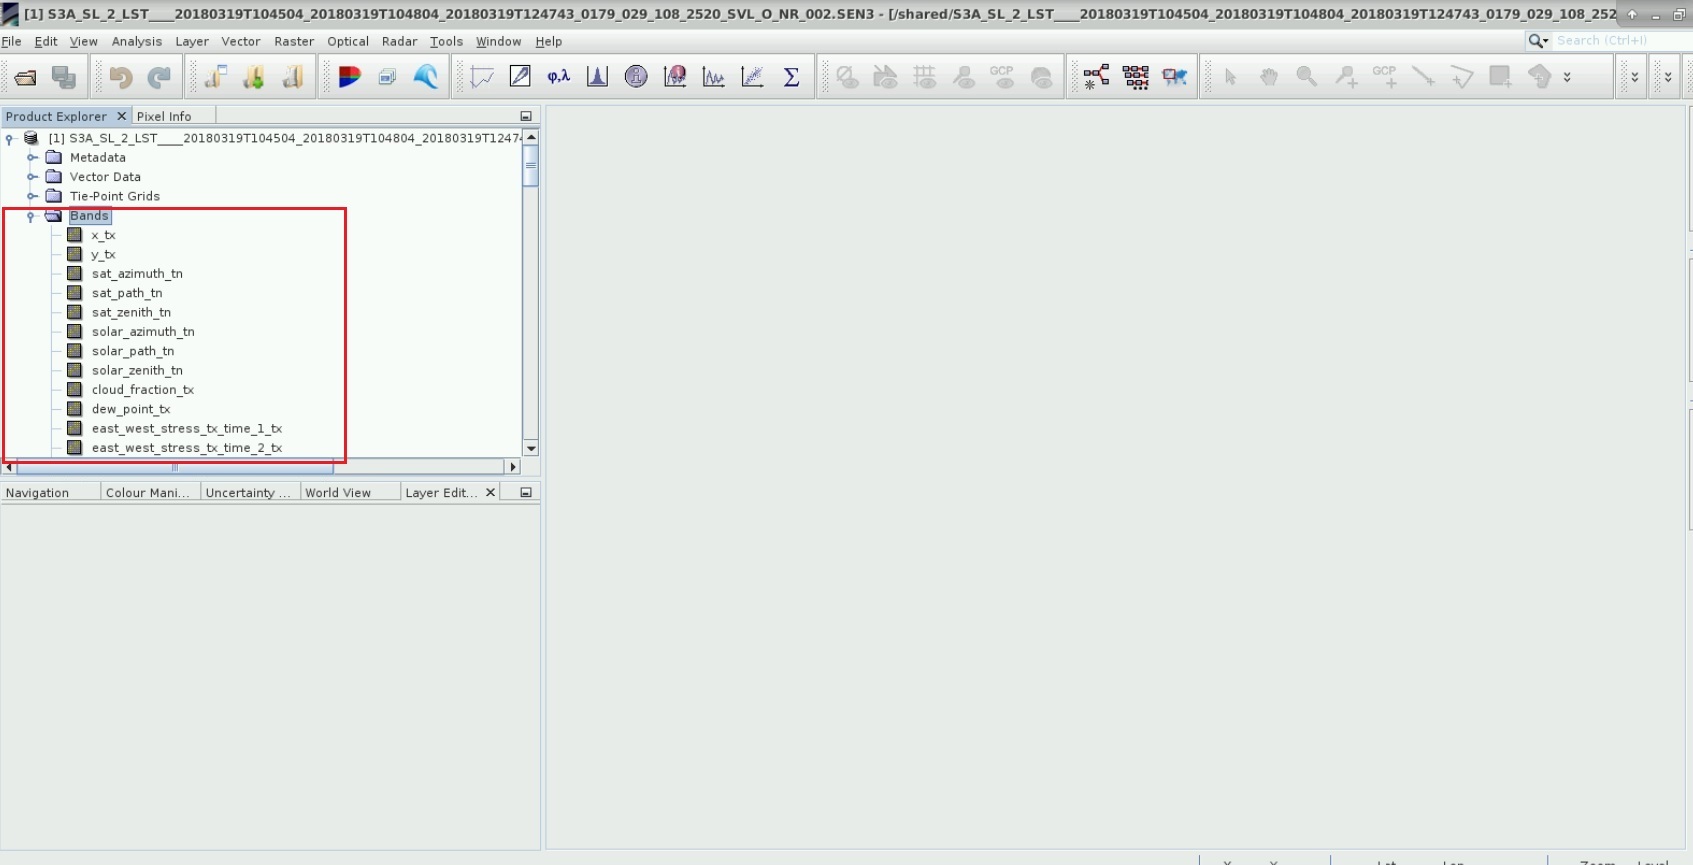
Basically it seems that on Ubuntu information are switched, e.g. bands with tie-point grids (please have a look at the screens below) and so incorrectly visualized. Therefore Masks are missing. Same issues are observed using the snappy python plugin.
Tie points grid in Windows:
Tie point grids under Bands in Ubuntu:
I see your images, but I really don’t understand how this can happen.
This is how it looks on my Ubuntu (not a VM).
But actually I don’t think that this is caused by the VM. Strange!
Dear all,
we investigated this issue in more detail and found the problem (SIIITBX-180).
We will release an module update which will fix this in the next could of weeks.
1 Like
Super! Thanks a lot