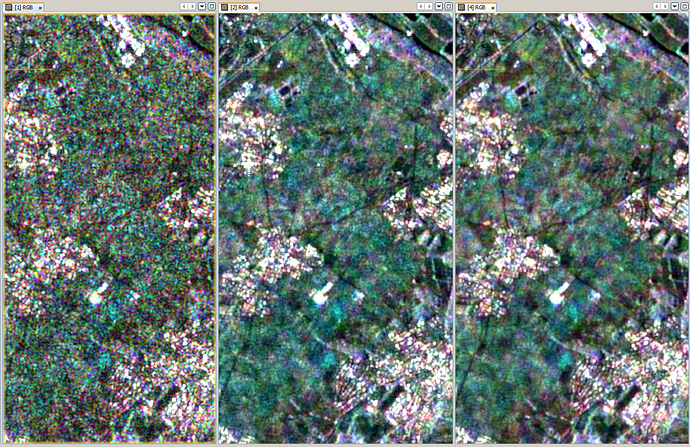
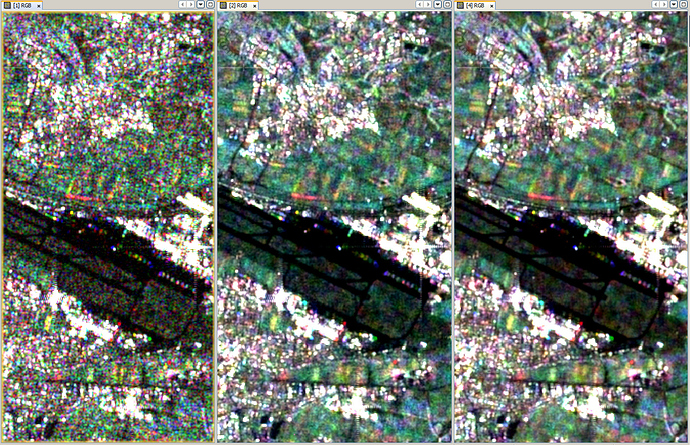
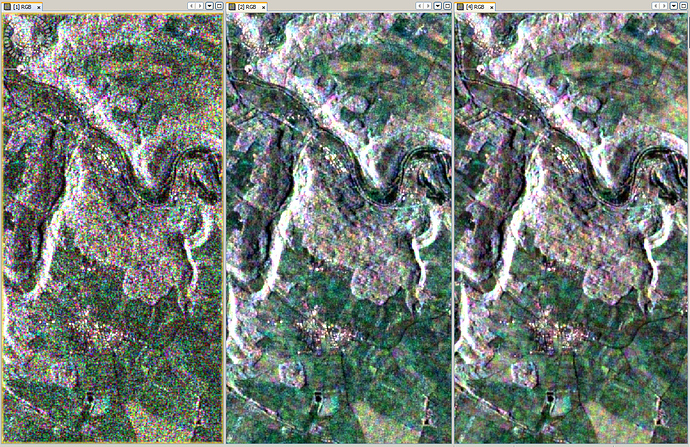
Single or Multi-temporal speckle filter?

This is a great example and im working on something similar at the minuite so glad i found it - when you say 15 source bands, how many separate files does that comprise? Are you counting Amp and intensity in VV and VH as four?

Edit - what steps are required? I have to create to sigma0 first, then ‘register’ according to the help. Is this the geometric correction or the actual coregistration or both? Is it possible to do any of this with a subset only?

A quick update on my progress. I coregistered three S1a images and then run the multitemporal change detection. i did not get any errors but it does not look like it worked.

  • Should I be stacking instead of coregistering?
  • Is three images (i.e. 6 bands, VV and VH x 3) enough for a test?
  • Is radiometric correction all that needs applying at first?
  • How many bands will the output image have? I input an image with 6 and got 6 back as output.

Thanks in advance for any tips.

did you make a RGB image out of the stack to check the quality of the coregistering?
If it is not sufficient, you could also apply the orbit files before coregistering or increase the GCPs and search windows.

I don’t know if there is a threshold of number of input images which grants better results but from my estimation it should be at least 5 for multi-temporal filtering. Consider the amount of speckle in one area. If you have only three images the variation for one pixel is still quite random, let’s say -32 -25 and -20. The filter cannot know if the variation is due to temporal change or speckle effect. But if you have 5 values instead, there is at least some statistical mean which is more robust than based on three values.

If there are VV and VH in one image they are treated as two individual input layers. The filter doesn’t make a difference between polarizations.

You get exactly the same number of bands as output, but each one is filtered by the other n-1 bands.

Thanks for the tips - ill keep trying. i had 6 inputs into the last and will try for more.

I don’t think that VV and VH should be mixed inside the multitemporal filter. It may give OKish-looking results but I’m quite sure that there are cases where it produces clearly incorrect results.

I was thinking about this a lot. I agree that is is obvious that an area which is homogenous in VV can also be heterogenous or even completely different in VH. But to my understanding this only affects the intensity of the filter.
If an area is homogenous throughout a stack the filter considers all the variation as speckle and therefore is more rigorous.
If it is different throughout a stack (maybe due to temporal changes or different polarizations) the filtered result is less smoothed but not necessarily wrong.
I made a few tests and didn’t find that a pattern from one image is transposed or ‘copied’ into the others during the multi-temporal filtering.

How do you think larger errors could occur?

There could be cases where due to regular structures the targets look very different in VV/VH, which could render the multitemporal filter unusable.

This could be tested from a suitably large stack of dual-pol acquisitions. Use the Quagan-filter separately for VV and VH stacks and then for the combined stack and see what the differences are. If you calculate the Quegan-filter “by hand” you could even compute the multitemporal-part of the filter from the VH-stack and then use it for the VV-stack and see if weird stuff happens.

thanks for the explanation - I will try this and let you know.

1 Like

In order to test if different polarizations interfere in multi-temporal speckle filtering I made the following tests:

I downloaded 11 Sentinel-1 images in dual polarization (VH VV), applied orbit files and coregistered them.
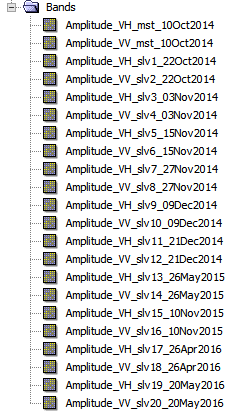
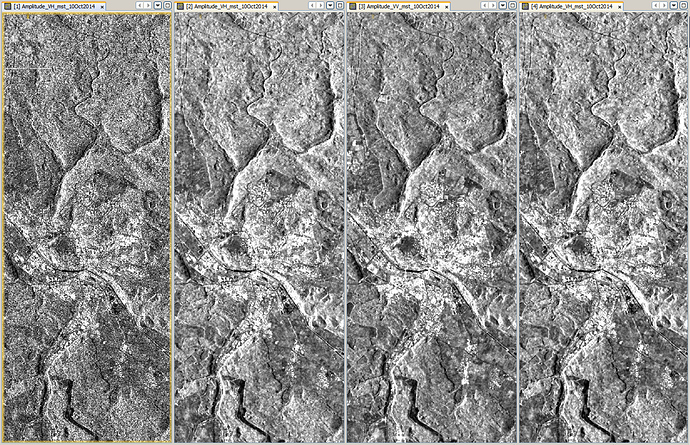
As you can see, the temporal range is about 1.5 years. Unfortunately, the data is not evenly distributed over the given time span. I therefore used 03.11.14 / 15.11.14 and 27.11.14 for RGB image as they had the smallest temporal baseline.

The following results show:

  1. Unfiltered data
  2. Multi-temporal filter on VH data only
  3. Multi-temporal filter on VV data only
  4. Multi-temporal filter on both VH and VV data (VV-RGB is shown)

Filter size was 3x3, I used the Quegan filter from the NEST toolbox.

First comparison doesn’t show much difference:

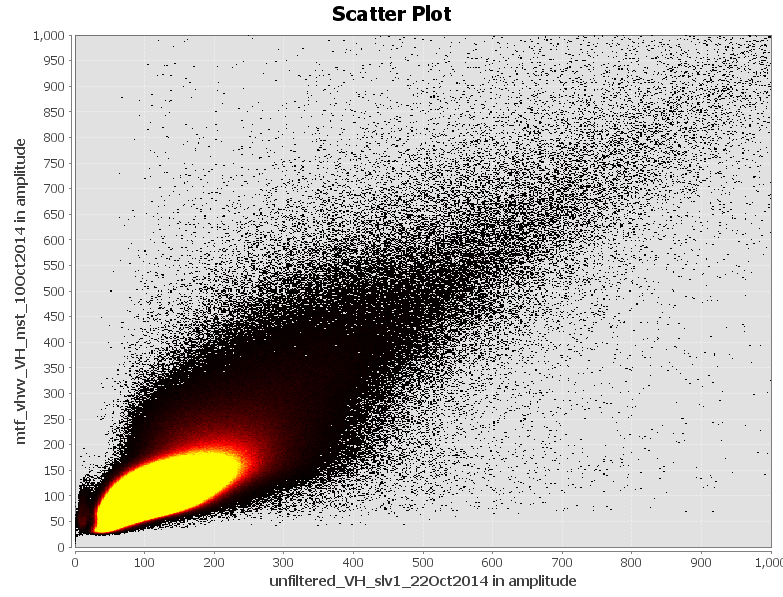
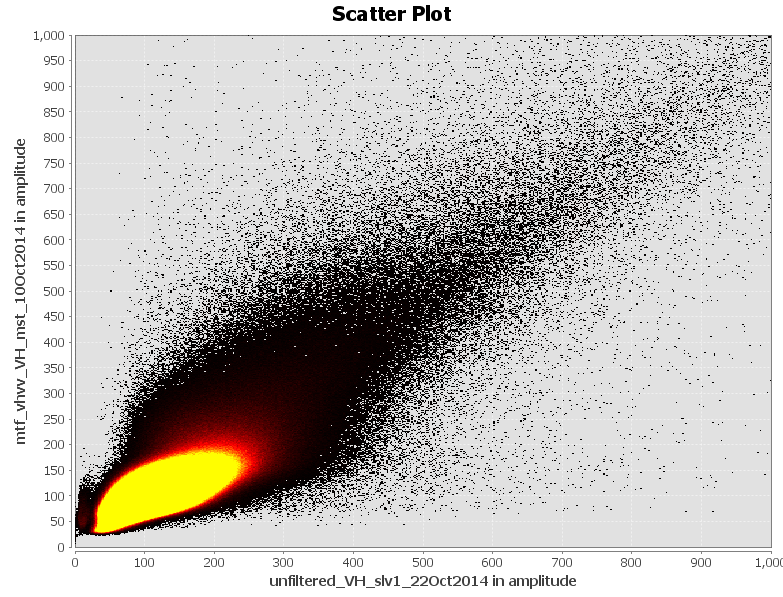
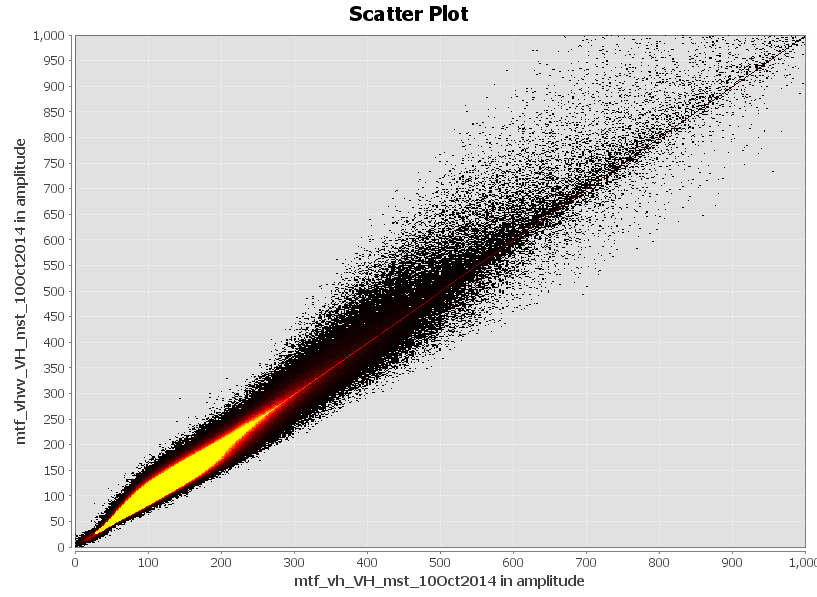
I then made a crosstable between the data sets from 10.10.14 to see how similar they are:
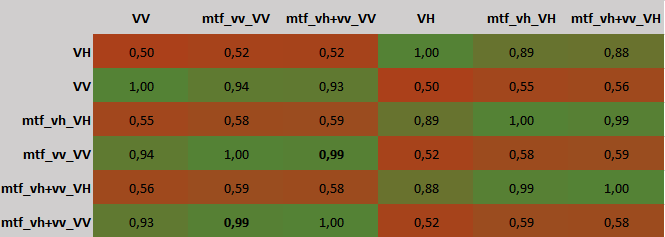
It shows that the results of single-polarization filtering (mtf_vv_VV) are nearly the same (bold r² = 0.99) as the results from dual-polarization filtering (mtf_vh+vv_VV). . In turn, the correlation of unfiltered data (VV) to filtered (mtf_vh+vv_VV) is clearly smaller (r² = 0.93). These numbers give a small idea of the differences between unfiltered, single-polarization filtered and dual-polarization filtered data but cannot explain the spatial dimension. 1% in a 5000x6000 pixel subset is about 300000 pixels (compared to 3 million in total).

unfiltered VH vs. single-polarization filtered VH


unfiltered VH vs. dual-polarization filtered VH

They are similar to a large degree.

single-polarization filtered VH vs dual-polarization filtered VH

So there are differences in the image, but we can’t tell if they are drastic.

So, let’s have a closer look at some areas. I tried to select areas with various land use types.

1.unfiltered
2. single-polarization filtered VH
4. dual-polarization filtered VH


Visually, some changes can be observed, but their impact is small. Due to the double number of input data sets the product of the dual-polarization filter is a bit smoother.
It surely depends on the application. Working with polarimetric signatures of the VH/VV Sentinel-1 IW mode I would personally disadvise filtering with both polarizations at once. But for simple image analyses, thresholds, classifications I can’t find any harm in doing it.

Any suggestions for further tests?

4 Likes

Good work. You can try studying the difference-images between the single vs. dual-pol filtered stacks to see where the differences are.

Thanks for the suggestion. I had a first look back then and the differences seemed quite random but I’ll give it a closer look.

@ABraun, could you please write how much time was spent on treatment in both cases? ( I mean for Single Lee Sigma (1 source band, Lee Sigma, 1 Look, Window 7x7, Sigma 0.9, Target 3x3) and
Multi-temporal Lee Sigma (15 source bands, Lee Sigma, 1 Look, Window 7x7, Sigma 0.9, Target 3x3))

sorry, I can’t remember. I used a machine with 32GB RAM so it only took a couple of minutes in all cases.

Oh really? I used 16 GB and core i7 mac book and 1 cycle in batch takes about 15 minutes for 8 products (VV VH). Without multi speckle filtering it took <1 min per one cycle.

(Read - ApplyOrbitFile - ThermalNoiseRe - Calibr - MultiSpeckle - TerCorrection - LinearToFromdB - Write)

i didn’t use the batch mode, I was only referring to the multi-temporal speckle filter.

ABraun - Could you explain how you got those coregistered S1 files into one product, as shown in your Sep 23 screen shot of the Bands in your product? I’m trying to play with multitemporal filtering and that part is eluding me.

I can coregister two S1 files at a time, but how can I combine several such products into one?

The Radar > Coregistration > Coregistration dialog throws an error when it senses multiple inputs as S1 TOPS files, so that doesn’t work.

The S1 TOPS Coregistration dialog only works with two files at a time.

I can create a 2-file coregistration workflow and open it in the Batch Processor along with all of the input files in my time series, but I’m not sure which master it is selecting and the output products have strange names. *** AND *** the burst that I’m trying to coregister has different numbers for different collects in my time series!

I apologize, I know the answer is probably easy, but I haven’t found it on my own.

Thanks,

Tom

to be honest, I used GRD data. So I added all of them in the coregistration dialogue and it worked.
I’m not sure how to do it with multiple TOPS files, sorry. But I’ll have a try later.

Think I got it. With three separate S1 SLC files, make a Workflow that coregisters them all (everything to the left of and including the Back-Geocoding box below), then pass the results to MTSF (with an intermediate debursting step required). The Terrain Correction is just there to help me visualize things.

The output is a product like that below, which is what I expected (with the 20Apr collect being the master and the two other collects being slaves):

Assuming this is correct (and if I’m wrong, somebody please speak up), I’d like to respectfully opine that discovering this process was a bit harder than it needed to be. If the MTSF dialog would accept Bands that weren’t in the same product, this would have been easier to do. If the Stack Creation dialog would allow S1 TOPS SLC products, ditto. If the S1 TOPS Coregistration dialog would allow more than two products to be coregistered, ditto. If SNAP had some easy method to simply copy a band from one Product into another, ditto.

Again, I hate to complain, but yikes - I tried a lot of things before luckily hitting on one that worked. I’m not the sharpest wavelength in the spectrum, but for such a simple, seemingly common, task, that took a while to discover.

Fingers crossed that I actually did it right :slight_smile:

Thanks,

Tom

1 Like

thanks for showing. Good luck - I would be interested in the results.

Maybe one hint lveci gave yesterday in a similar topic

So, if it takes too long, you could stop after the back geocoding and start the debursting separately.

Good morning, I am trying to create a graph as @tqrtuomo, but I have this error : “Please select two source products” that appears in the back geocoding step: Maybe I have to change one of the parameter but I don’t know which one to choose, if someone could help me.
Thanks