Single or Multi-temporal speckle filter?

Dear all,

I download several GRD products in the same area for change detection. When it comes to speckle filter, I am kind of confused. Which one performs better, the single product speckle filter or Multi-temporal speckle filter?

If I choose the Multi-temporal speckle filter, then how many images is recommanded to process at the same time?

Thanks

They both function the same way. The multitemporal will apply a weighted average of the selected filter across all images of a time series. If the filter in intended to preserve edges or whatever, it will still do that, it just considers more inputs from the other images.
There’s no limits on the number of image but you may want to consider changes in the scene such as seasonal changes.

2 Likes

@lveci
Thanks for your timely reply. It’s clear to me now.

But I sitll have some questions about speckle filtering.

  1. After updated to SNAP 3.0, two new method (Lee Sigma and IDAN)are added to the Speckle Filter toolbox, but there seems no updating on these methods in the help doucument. what’s the meaning of the “Sigma” and “Target Window Size” parameters in the “Lee Sigma”? Is there any materials about these new methods?

  2. In the “Refined Lee” method, the old “Edge threshold” parameter is gone, then how did it detect the edges? What the default window size of this method?

  3. What’s the effect of the “Number of Looks” parameter in some filter? After setting the parameter to 3, the range and azimuth looks of the output are still the same as the input file.

For Gaussian distribution, two-sigma probability is defined as the probability of a random variable being within two standard deviations of its mean. For example, the two-sigma probability for a one-dimensional Gaussian distribution is 0.955. This can be interpreted as meaning that 95.5% of random samples lie within two-sigma of its mean. The initial Lee Sigma filter is based on this idea. For a given pixel, a sliding window with used selected window size is defined. Among all pixels in the sliding window, only pixels within the two-sigma range are used in filtering the given pixel. Here in the operator UI, “Sigma” is not the stander deviation, instead it represents the two-sigma probability. The larger the sigma value, the more pixels are used in the filtering. However, not all pixels in the SAR image are filtered with Lee Sigma filter. We want to preserve those point targets in the original image. A “Target Window” is used in detecting those point targets. The “Target Window Size” parameter in the UI defines the size of the target window. For details of the Lee Sigma filter, please see “[2] J.S. Lee, J.H. Wen, T.L. Ainsworth, K.S. Chen and A.J. Chen, “Improved Sigma Filter for Speckle Filtering of SAR Imagery”, IEEE TRansaction on Geoscience and Remote Sensing, Vol. 47, No. 1, Jan. 2009.” for reference.

For “Refined Lee” filter, the default window size is 7x7 and edge detection is performed using local gradients.

The “Number of Looks” parameter in some of the speckle filters is generally used in estimating the speckle noise standard deviation. The larger the number of looks, the smaller the noise standard deviation. This parameter does not change the image dimension.

6 Likes

Thanks, @junlu . I’ve learned a lot from your detailed answer.
“Lee Sigma” seems very interesting to me, and I’ll have a try.

for those wondering what a multi-temporal speckle filter is capable of: I have made 2 comparisons for a stack of 15 S1 images and found the results quite astonishing:

  1. Raw Image
  2. Single Lee Sigma (1 source band, Lee Sigma, 1 Look, Window 7x7, Sigma 0.9, Target 3x3)
  3. Multi-temporal GammaMap (15 source bands, size 3x3)
  4. Multi-temporal Lee Sigma (15 source bands, Lee Sigma, 1 Look, Window 7x7, Sigma 0.9, Target 3x3)

Airport near the city:

Another area with smaller houses:

13 Likes

Excellent comparison, thank you! Could you add the filter parameters you used?

thank you - good idea. I updated the post above.

I found it interesting how the quality increases from unfiltered over single to multi-temporal.

Multi-temporal Lee Sigma seems to preserve features very well. The amount of speckle-reduction can be quantified by calculating the Equivalent Number of Looks (ENL) over a quasi-homogeneous area.

1 Like

This is a great example and im working on something similar at the minuite so glad i found it - when you say 15 source bands, how many separate files does that comprise? Are you counting Amp and intensity in VV and VH as four?

Edit - what steps are required? I have to create to sigma0 first, then ‘register’ according to the help. Is this the geometric correction or the actual coregistration or both? Is it possible to do any of this with a subset only?

A quick update on my progress. I coregistered three S1a images and then run the multitemporal change detection. i did not get any errors but it does not look like it worked.

  • Should I be stacking instead of coregistering?
  • Is three images (i.e. 6 bands, VV and VH x 3) enough for a test?
  • Is radiometric correction all that needs applying at first?
  • How many bands will the output image have? I input an image with 6 and got 6 back as output.

Thanks in advance for any tips.

did you make a RGB image out of the stack to check the quality of the coregistering?
If it is not sufficient, you could also apply the orbit files before coregistering or increase the GCPs and search windows.

I don’t know if there is a threshold of number of input images which grants better results but from my estimation it should be at least 5 for multi-temporal filtering. Consider the amount of speckle in one area. If you have only three images the variation for one pixel is still quite random, let’s say -32 -25 and -20. The filter cannot know if the variation is due to temporal change or speckle effect. But if you have 5 values instead, there is at least some statistical mean which is more robust than based on three values.

If there are VV and VH in one image they are treated as two individual input layers. The filter doesn’t make a difference between polarizations.

You get exactly the same number of bands as output, but each one is filtered by the other n-1 bands.

Thanks for the tips - ill keep trying. i had 6 inputs into the last and will try for more.

I don’t think that VV and VH should be mixed inside the multitemporal filter. It may give OKish-looking results but I’m quite sure that there are cases where it produces clearly incorrect results.

I was thinking about this a lot. I agree that is is obvious that an area which is homogenous in VV can also be heterogenous or even completely different in VH. But to my understanding this only affects the intensity of the filter.
If an area is homogenous throughout a stack the filter considers all the variation as speckle and therefore is more rigorous.
If it is different throughout a stack (maybe due to temporal changes or different polarizations) the filtered result is less smoothed but not necessarily wrong.
I made a few tests and didn’t find that a pattern from one image is transposed or ‘copied’ into the others during the multi-temporal filtering.

How do you think larger errors could occur?

There could be cases where due to regular structures the targets look very different in VV/VH, which could render the multitemporal filter unusable.

This could be tested from a suitably large stack of dual-pol acquisitions. Use the Quagan-filter separately for VV and VH stacks and then for the combined stack and see what the differences are. If you calculate the Quegan-filter “by hand” you could even compute the multitemporal-part of the filter from the VH-stack and then use it for the VV-stack and see if weird stuff happens.

thanks for the explanation - I will try this and let you know.

1 Like

In order to test if different polarizations interfere in multi-temporal speckle filtering I made the following tests:

I downloaded 11 Sentinel-1 images in dual polarization (VH VV), applied orbit files and coregistered them.

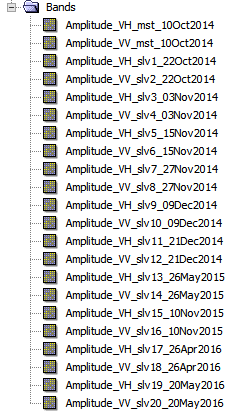
As you can see, the temporal range is about 1.5 years. Unfortunately, the data is not evenly distributed over the given time span. I therefore used 03.11.14 / 15.11.14 and 27.11.14 for RGB image as they had the smallest temporal baseline.

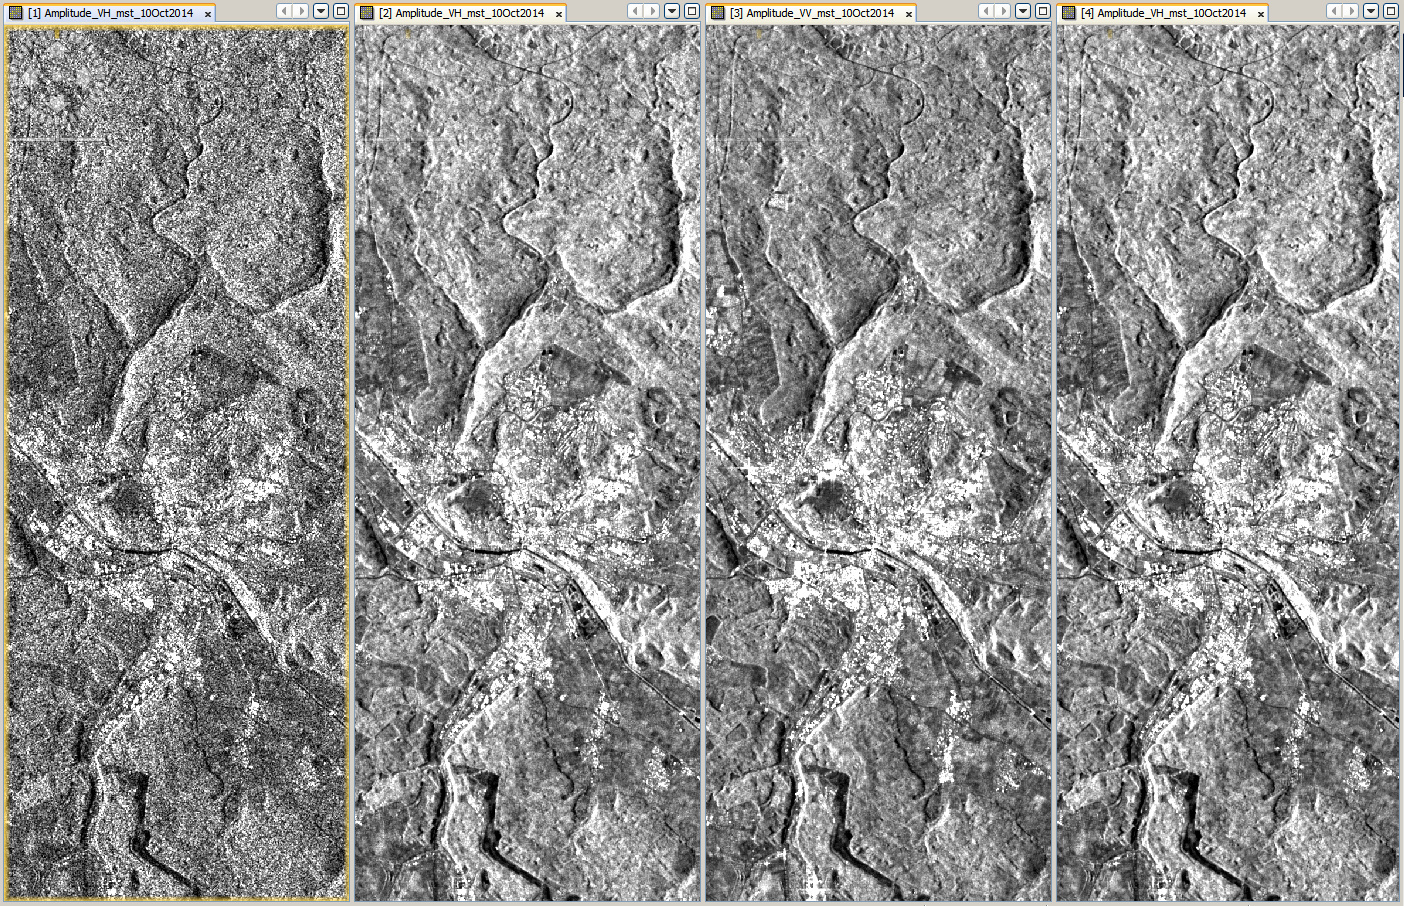
The following results show:

  1. Unfiltered data
  2. Multi-temporal filter on VH data only
  3. Multi-temporal filter on VV data only
  4. Multi-temporal filter on both VH and VV data (VV-RGB is shown)

Filter size was 3x3, I used the Quegan filter from the NEST toolbox.

First comparison doesn’t show much difference:

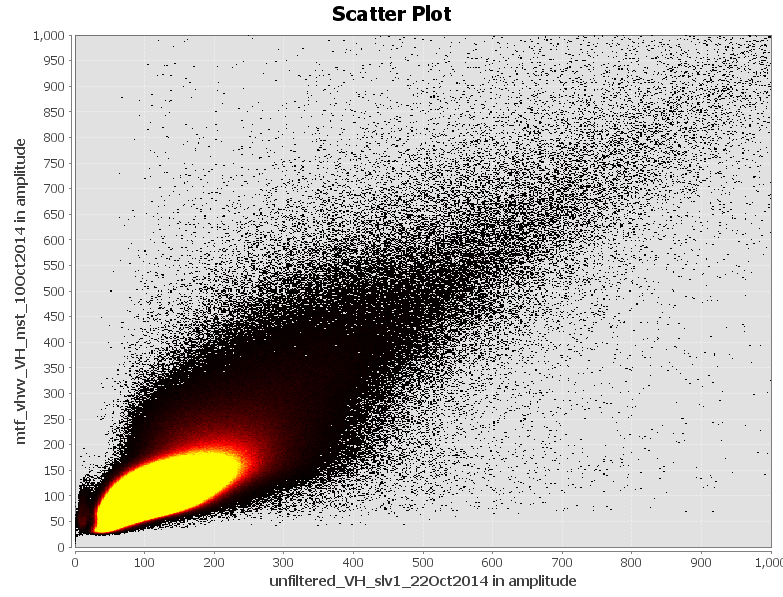
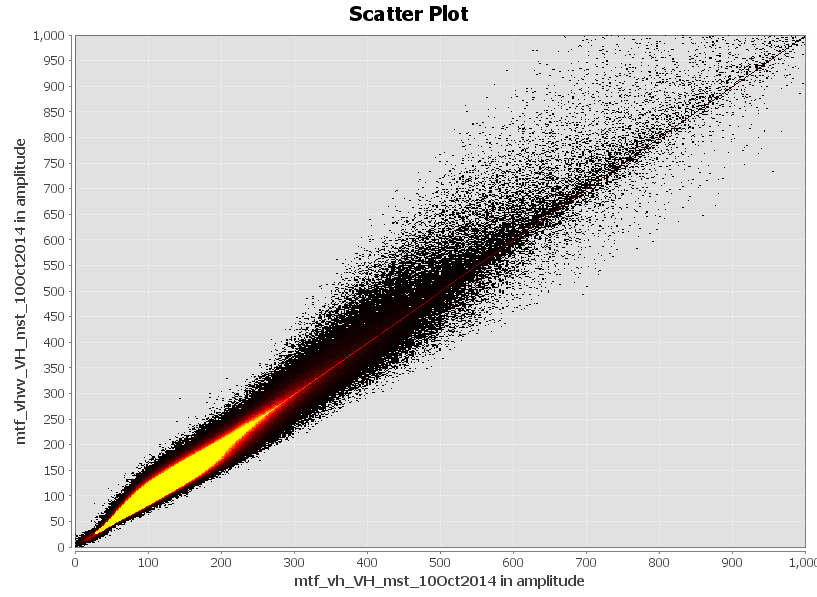
I then made a crosstable between the data sets from 10.10.14 to see how similar they are:

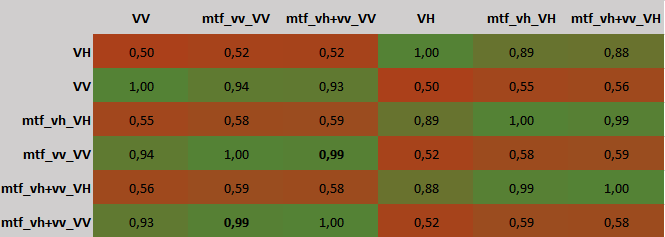
It shows that the results of single-polarization filtering (mtf_vv_VV) are nearly the same (bold r² = 0.99) as the results from dual-polarization filtering (mtf_vh+vv_VV). . In turn, the correlation of unfiltered data (VV) to filtered (mtf_vh+vv_VV) is clearly smaller (r² = 0.93). These numbers give a small idea of the differences between unfiltered, single-polarization filtered and dual-polarization filtered data but cannot explain the spatial dimension. 1% in a 5000x6000 pixel subset is about 300000 pixels (compared to 3 million in total).

unfiltered VH vs. single-polarization filtered VH


unfiltered VH vs. dual-polarization filtered VH

They are similar to a large degree.

single-polarization filtered VH vs dual-polarization filtered VH

So there are differences in the image, but we can’t tell if they are drastic.

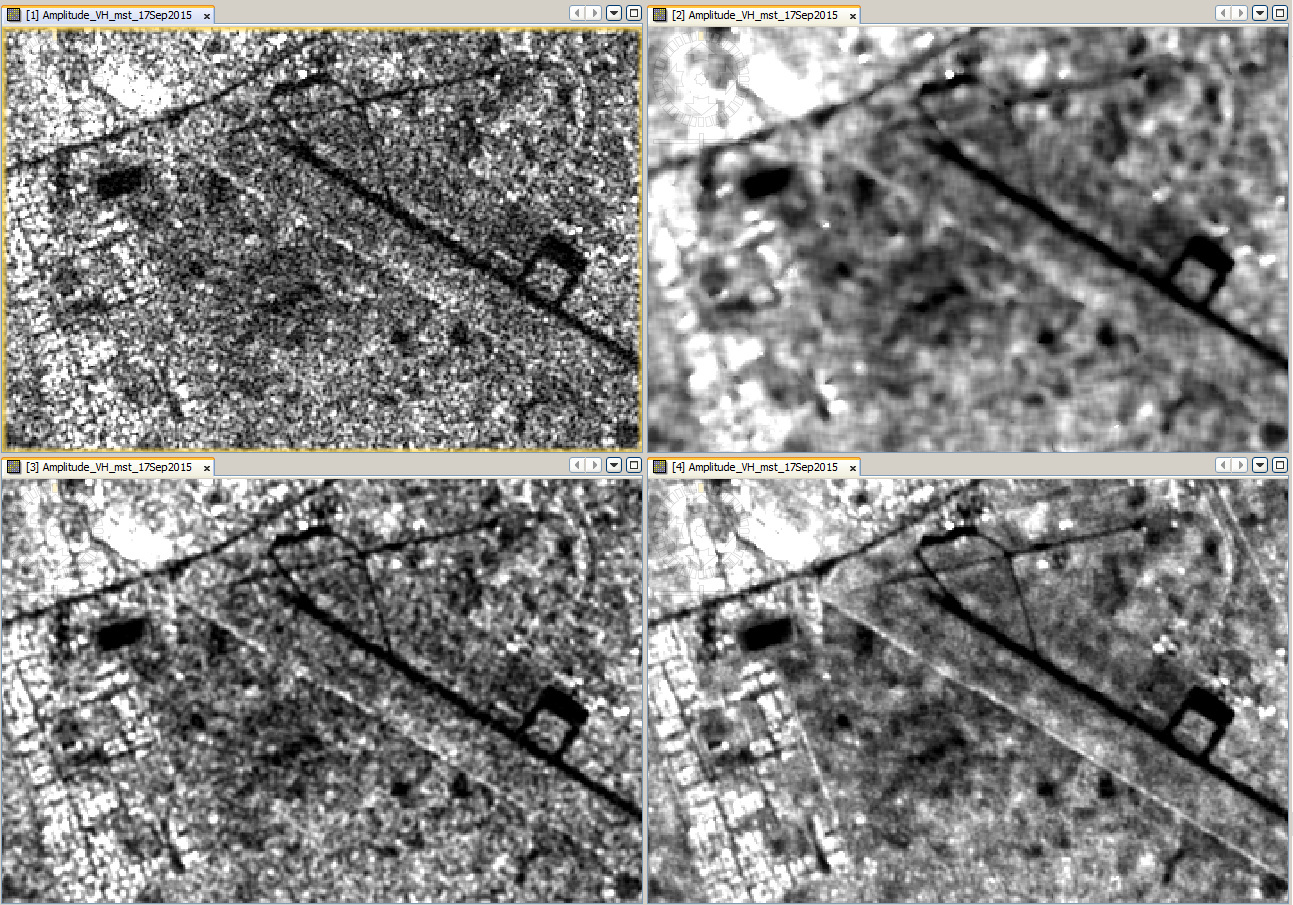
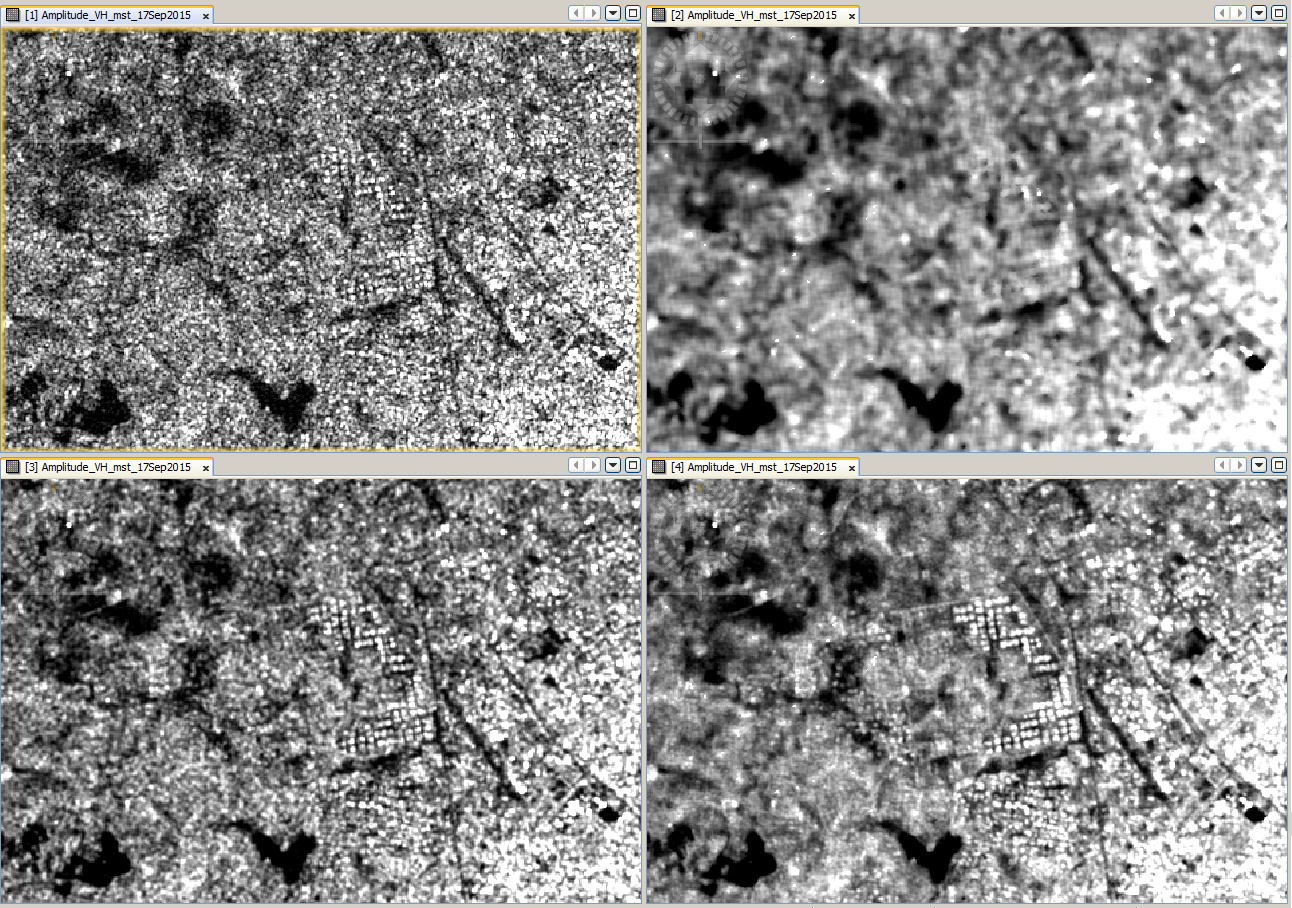
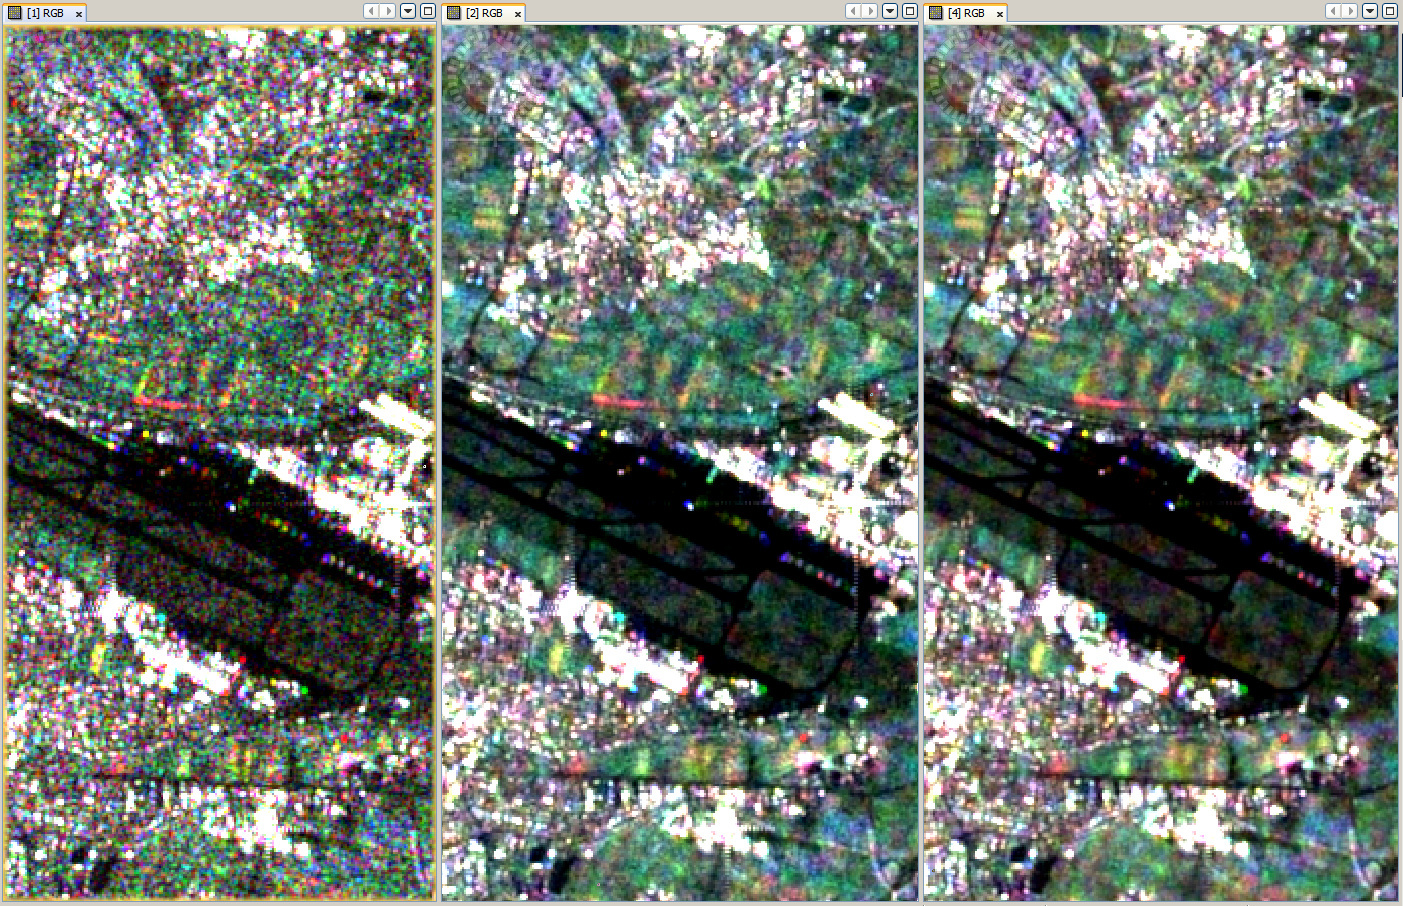
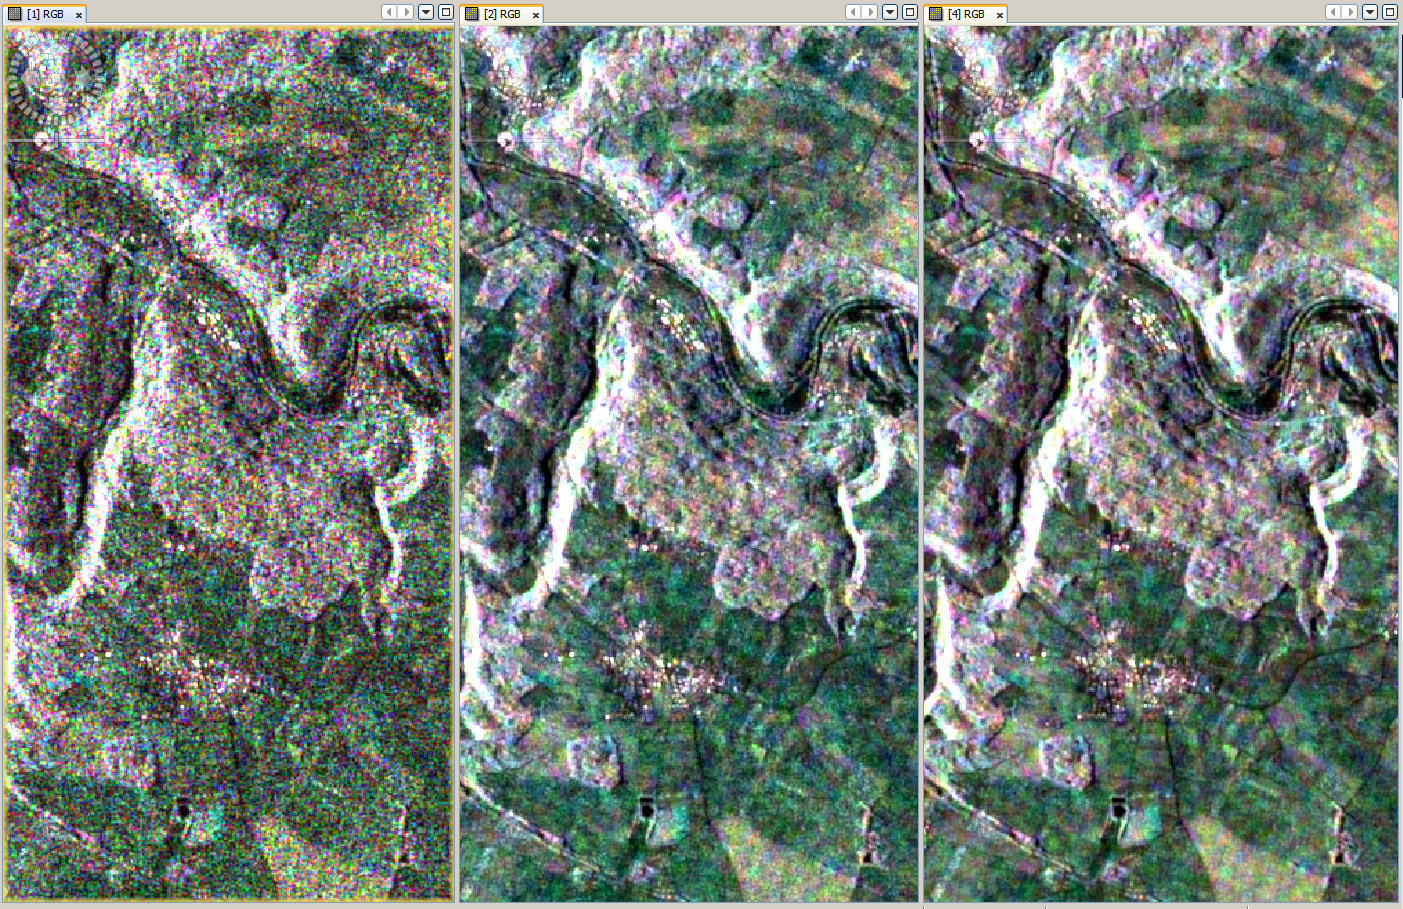
So, let’s have a closer look at some areas. I tried to select areas with various land use types.

1.unfiltered
2. single-polarization filtered VH
4. dual-polarization filtered VH


Visually, some changes can be observed, but their impact is small. Due to the double number of input data sets the product of the dual-polarization filter is a bit smoother.
It surely depends on the application. Working with polarimetric signatures of the VH/VV Sentinel-1 IW mode I would personally disadvise filtering with both polarizations at once. But for simple image analyses, thresholds, classifications I can’t find any harm in doing it.

Any suggestions for further tests?

4 Likes

Good work. You can try studying the difference-images between the single vs. dual-pol filtered stacks to see where the differences are.

Thanks for the suggestion. I had a first look back then and the differences seemed quite random but I’ll give it a closer look.