hello ABraun
the first method was not worked for me either… when i did the band math with the above mentioned formula a new band appeared which look promising , but when i moving the mouse cursor over this newly created band image it did’t show the latitude and longitude value…
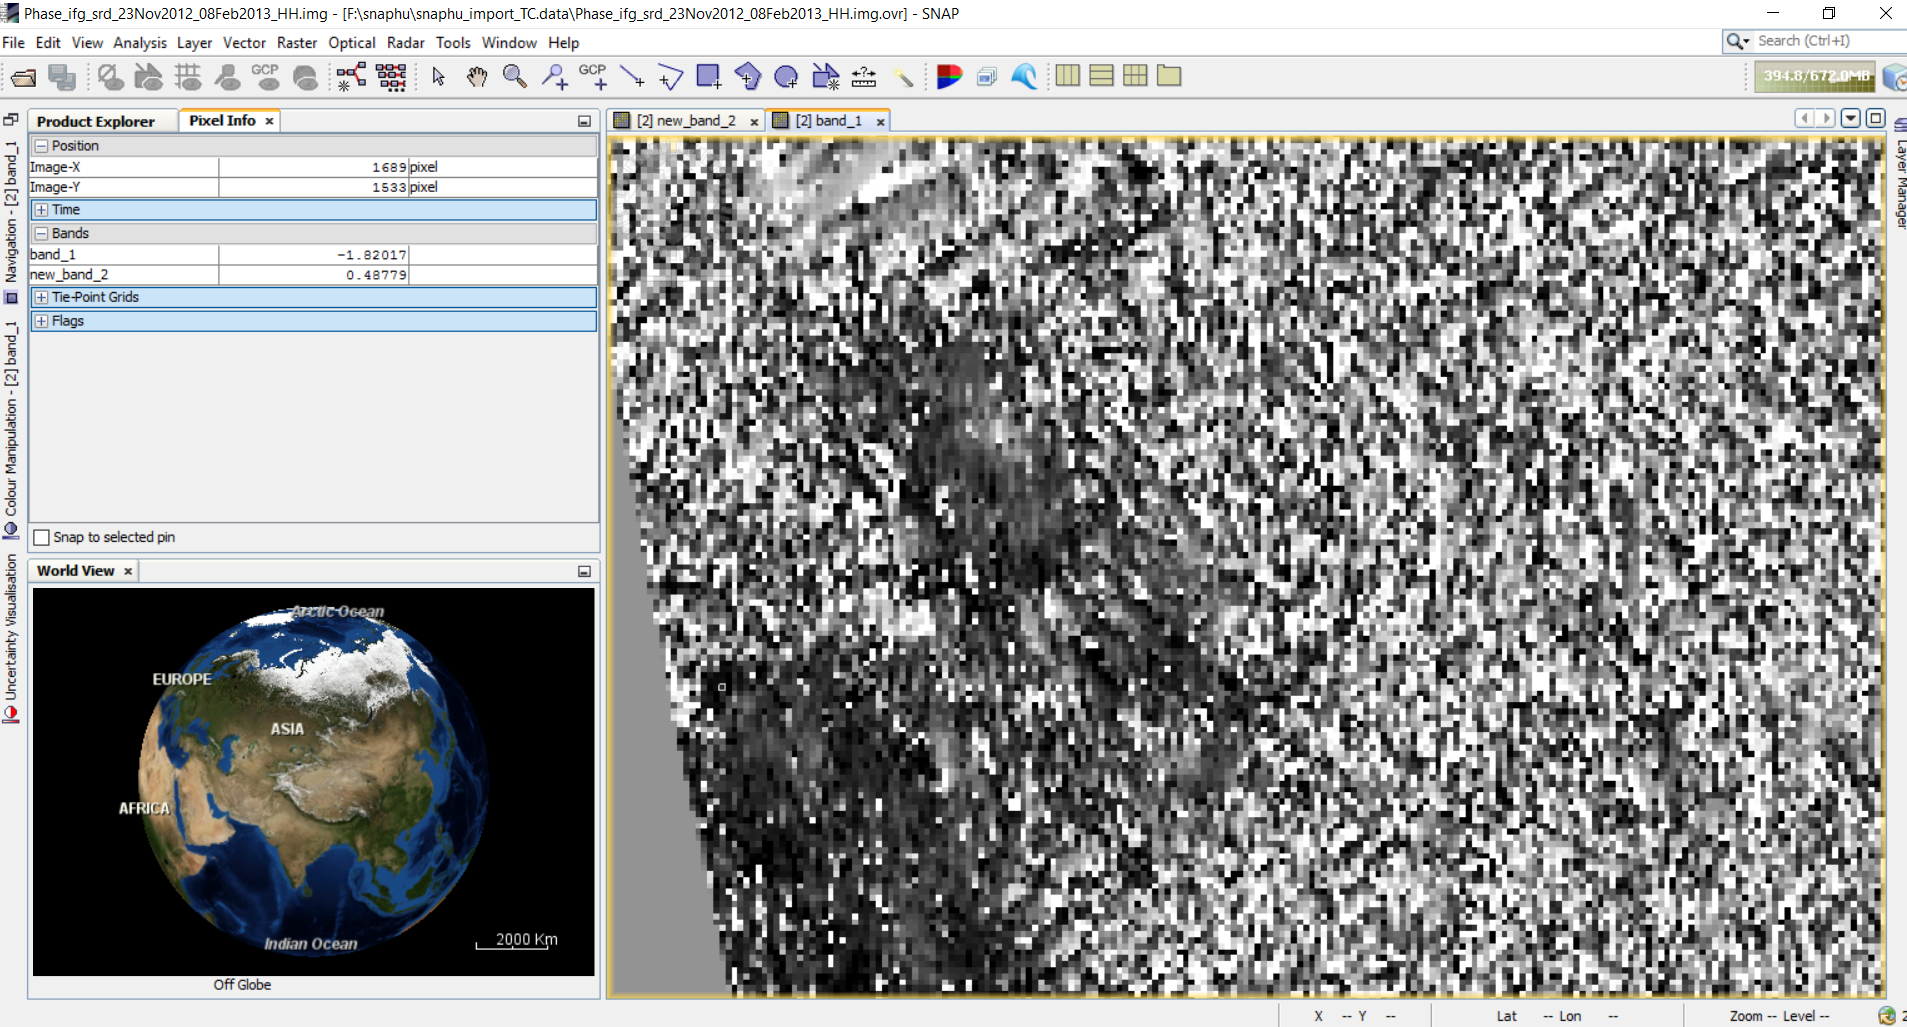
you can see the band values in the pixel info tab. If it is closed you can re-open it in the view menu. Note that the lat/lon values are not of importance but the pixel values of the band. Please tell us what you found.
You can also post screenshots in here by Ctrl+V or the upload dialogue.
yes ABraun i can see the band value… what does this value mean ? is it the subsidence or LOS displacement in millimeter or some metric unit…
one thing what does the minus and plus value means is it the the subsidence to the west or east depending on the satellite orbit i.e descending or ascending orbit…
if you entered the wavelength in mm those are values of LOS displacement in mm. You should now mask the areas with low coherence so only “trustful” values remain. Then you can select a reference point.
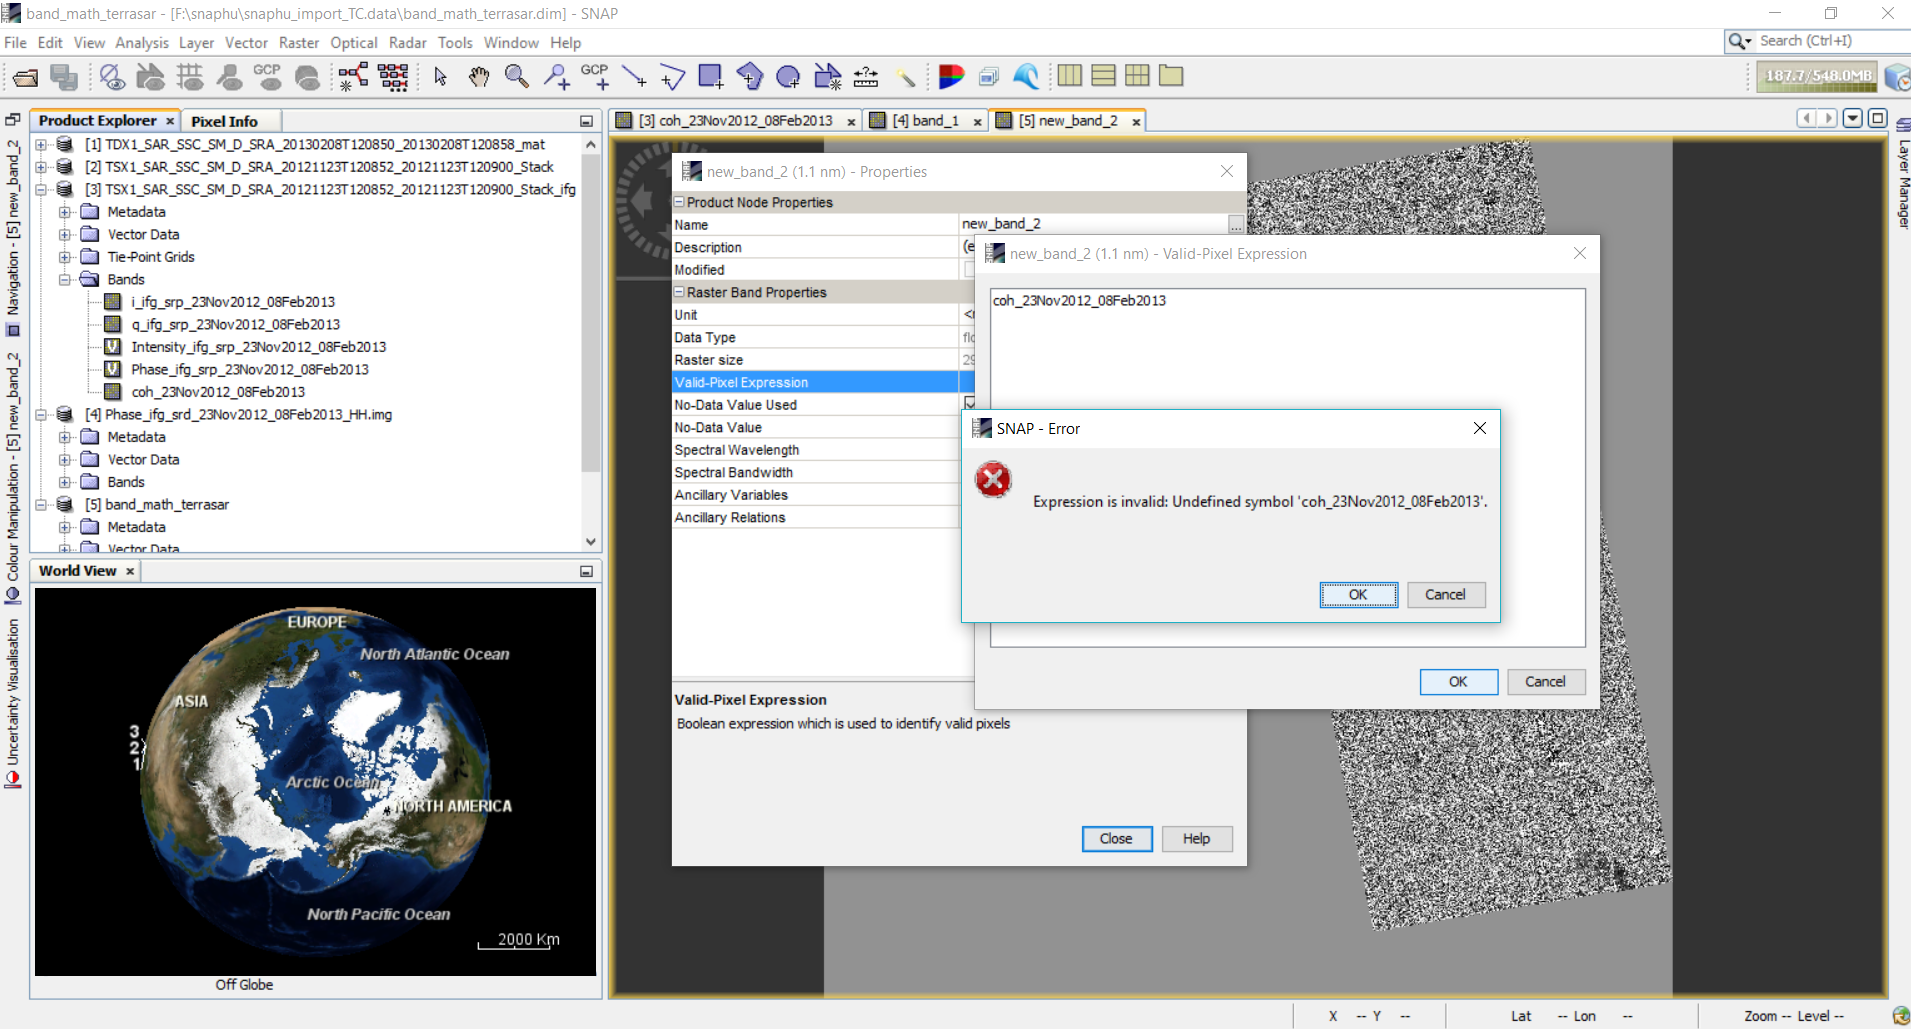
right-click on the unwrapped phase, in the menu you find properties. There is an entry “valid pixel expression”, where you enter something like coh_HH_11Feb2008_04Mar2008 > 0.6.
Of course, the coherence name should be yours and the threshold can also be lower. Some say acceptable quality begins with 0.3 already.
what does the minus and plus band value means is it the the subsidence to the west or east depending on the satellite orbit i.e descending or ascending orbit…
in your original image, the band after the applied formula of above, they are the relative changes of each pixel in look direction of the sensor between both images. After applying the reference height (setting no-change areas to zero) they are supposed to be the absolute change. Here, negative values imply subsidence, positive stand for uplift.
I explained it in the post above. Just entering the coherence is not a valid logical expression. In this field (valid pixel expression) you define at which locations your result is usable. As coherence is a measure for quality of the interferometric product you only want those pixels at a location where the coherence is larger than a threshold, let’s say 0.4.
Thus, just putting the coherence there is pointless because the expression is lacking a condition. Enter this instead: coh_23Nov2012_08Feb2013 > 0.4
Then you will have bad quality pixels masked out and only the “good” ones remain.
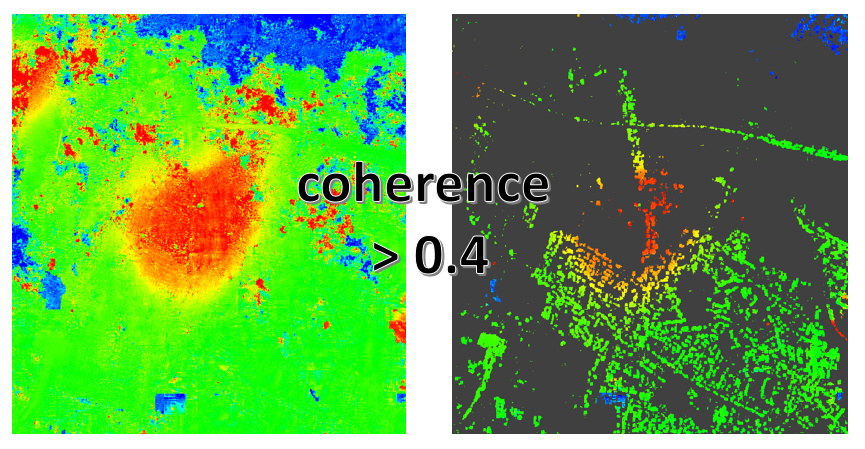
Depending on your colour scheme it should somehow look like this:
thank you, @heinzollerketchup.
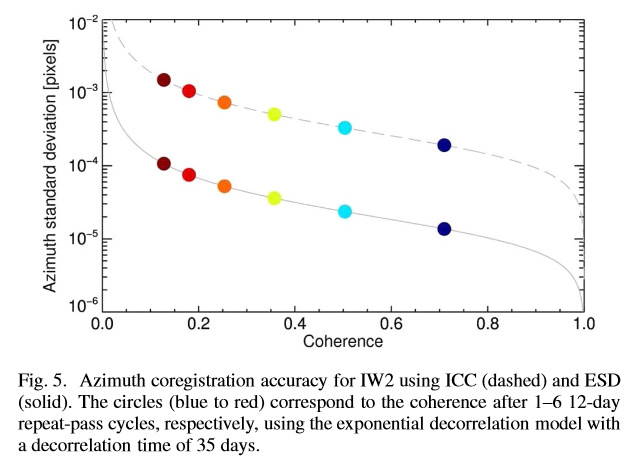
Generally, the longer the temporal baseline (=the time between two images) the higher is the decorrelation which leads to small coherence values. It also depends on the cover of the analyzed surface. Bare ground mostly shows slower decorrelation than one with high vegetation cover.
thanks again, your post just explains my second question. My study area (in Mongolia) and has a low coherence even in a 12 day time gap (mean 0.4). So according to your response this result is influenced by the surface (shrubs, woodland, grasland, bare soil) and not by the time interval.
Is there a possibility to increase the coherence in areas with covered earth surface?
The wavelength of Sentinel-1 is about 5 cm and strongly interacts with smaller vegetation cover such as shrubs. Ich these shrubs slightly change between two image acquisitions coherence rapidly decreases.
It cannot be increased by methods of data processing. Higher coherence can be achieved through precise orbit parameters, shorter time intervals and longer wavelengths (ALOS PALSAR with L-band, ca. 21 cm is less sensitive to smaller surface cover changes).
So all you can do with sentinel is applying the orbit files before your co-registration (also increase the number of GCPs) and hope that the coherence is of better quality.
"Select a point where you assume no change and read the value. Let’s say its 45 cm
Subtract 45 from your imagein order to have zero values at those areas with no change. The remaining variation should be due to subsidence between two overpasses."
can you explain it briefly … you say “45 cm”… from where I get this value for my case… is it from phase or coherence …from coherence map> properties> pixel information tab>band… little confused