Thanks a lot @Igor I do really appreciate your time and help !
One more thing when you said create new raster you meant save the whole product which contains the new_band_1 in a new dim file using file > save product > then it gives you to choose dim file
I am trying this now as it takes time for the bands product to be saved.
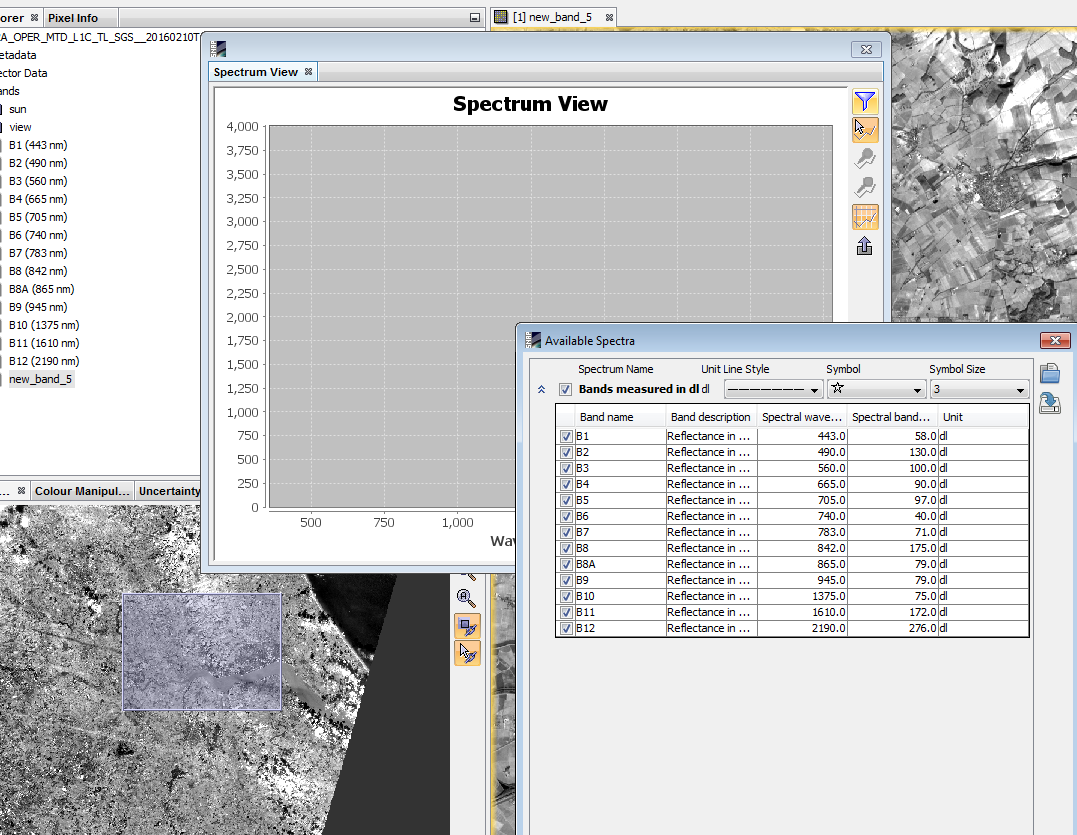
I did not get the new band reflectance value ! please see below. Maybe the way I am saving the product? can you explain plz how to save the new_band in raster ? thanks
I have also noticed that the 2.0.2 displays twice the real reflectance value, while with version 2.0 the result was OK.
Can this bug be fixed rapidly ?
Absolutely.
The digital numbers should not exceed the quantification value 10 000 (except on very specific cases).
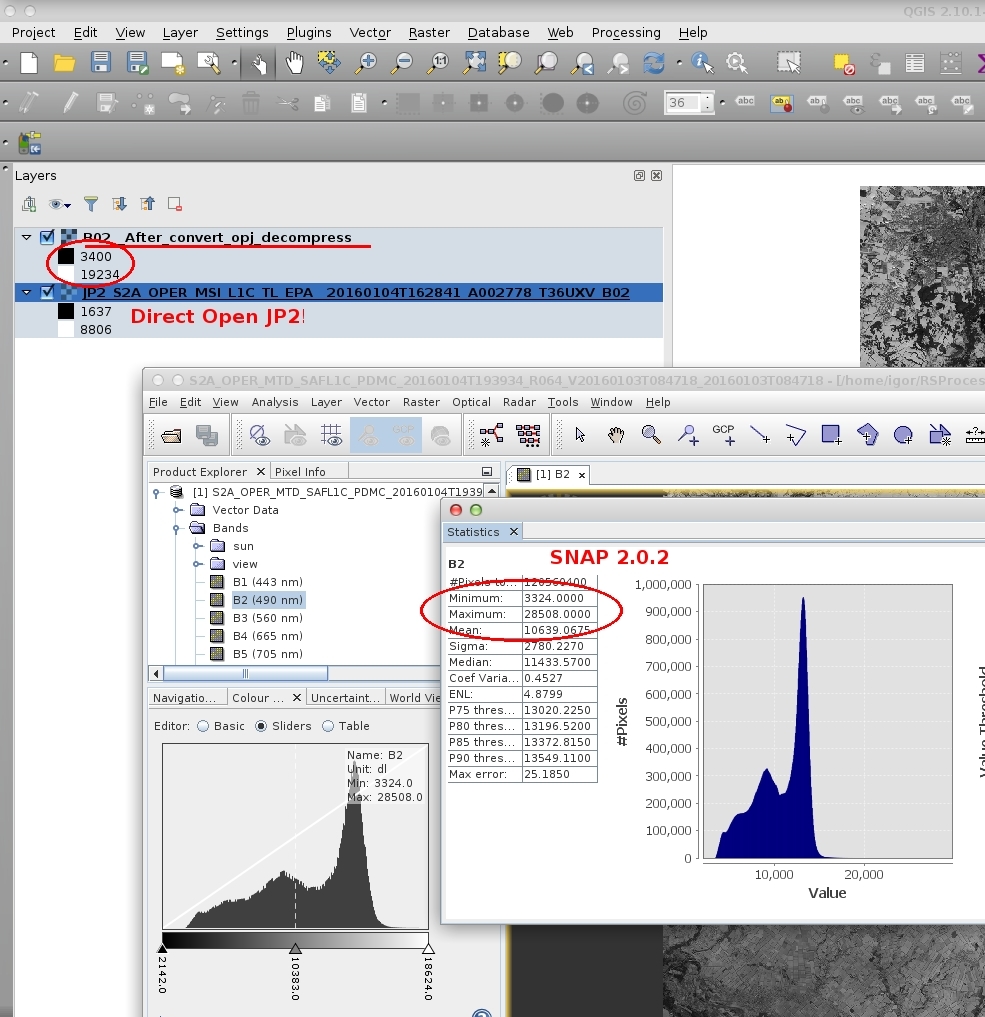
You can open the JP2000 files with QGIS for comparison.
Here is example data (Band 2).
Reflectance greatly exceeded after treatment opj_decompress (output format: GeoTIFF).
SNAP 2.0.2 also gives these values!
However, direct reading in QGIS gives other values. opj_decompress also contains bug???
Indeed, the OpenJPEG version we are using (2.1) has a very serious bug which appears with 15bpp JP2 file, when saving to TIF.
And we use the TIF output internally since SNAP 2.0.2, so this all makes sense.
The latest OpenJPEG code (post 2.1) even refuse to decompress S2 JP2 files to TIF since they are 15 bits, and the OpenJPEG TIF writer only supports even bpp (14 and 16 but not 15).
I have been able to generate a fixed OpenJPEG decompressor that outputs correct reflectance data. The output is bit-perfect comparable to what Kakadu outputs.
We will now update the JP2 decompressor used within SNAP to provide the fix.
Sadly a new SNAP release is happening just now (for 3.0), so this will be provided as a module update, in a day or two.
@Igor many thanks for reporting and investigating on your side.
Thank you jmalik.
Thanks to everyone who showed interest in this topic.
Now everything becomes clear.
The issue with QUANTIFICATION_VALUE should be closed.
Waiting for updates.
Dear all, SNAP 3.0, released today, provides the fix for this quite severe issue that slipped into 2.0.2 unnoticed.
All S2 data users should upgrade as soon as possible.
When installing the new version, you should wipe out your cache dir.
This can be done automatically by selecting “Yes, try deleting all SNAP user data” during installation.
Warning : doing this will remove your whole ~/.snap directory, including custom GPF graph files, RGB profiles, and all other auxiliary data that you may have downloaded (DEM, S1 orbit files, …). If this is too much, then simply delete ~/.snap/var/cache
The results of my comparisons on a test tile (Min/Max DN values).
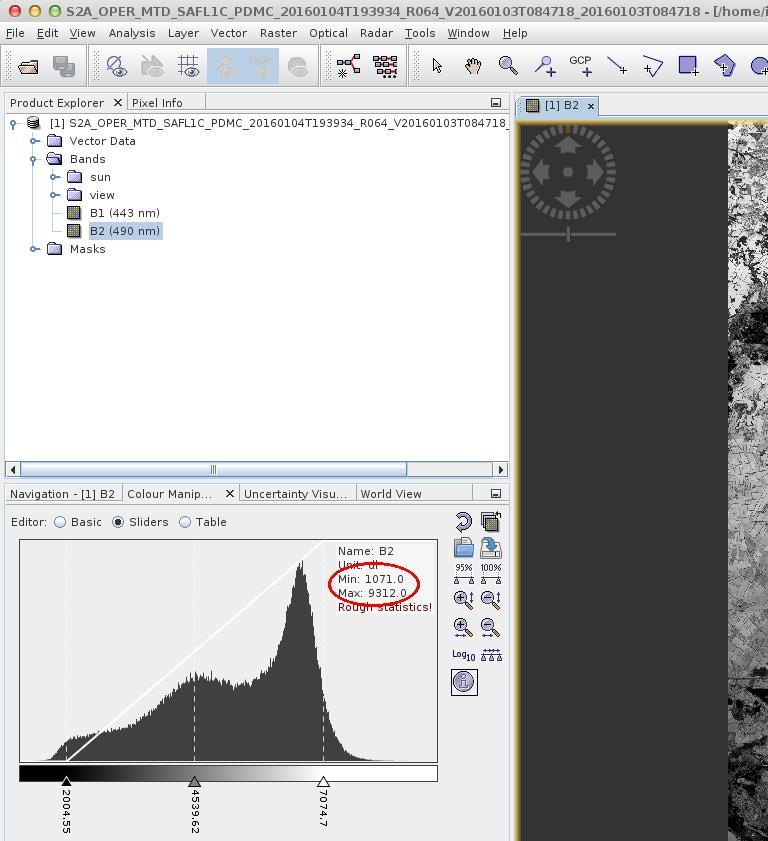
SNAP 2.0: 1071 - 9312
Direct open in QGIS 2.8.2: 1680 - 9355
After opj_decompress SNAP Edition to GeoTIFF and open it in QGIS 2.8.2: 1700 - 9617
SNAP 2.0.2: 2142 - 18624
After kdu_expand (Kakadu) decompress to GeoTIFF and open it in QGIS 2.8.2: 1662 - 14254
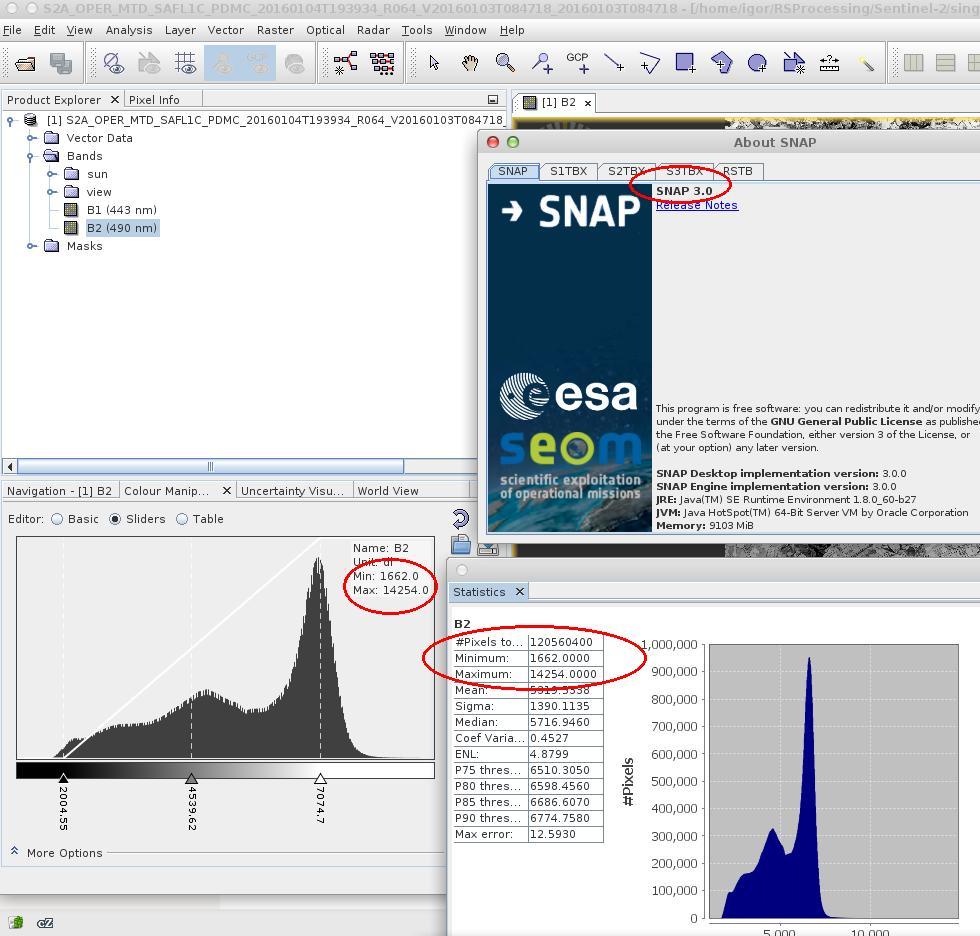
SNAP 3.0: 1071 - 9312
The result opj_decompress a bit high, but not more than QUANTIFICATION_VALUE.
Subject to the JP2 for Sentinel-2, three programs showed almost similar results. I think the SNAP 2.0 you can trust!
But! I THINK I’VE IDENTIFIED A NEW BUG IN SNAP 3.0! It occurs after the counting statistics! In the images below: a) the value before compute statistics; b) after counting the statistics. Figure b - values, as in the Kakadu software.
Although the drawing of the histogram seems correct.
How is that possible?
Thanks for confirming that SNAP 3.0 fixes the issue on your side.
As to the statistics computation, maybe you did not notice the “Rough statistics” warning in your first image.
Computing the exact histogram of a full image is time consuming, so when you open a product, only approximate statistics are computed. SNAP computes exact statistics only on-request (when running the Statistics or Histogram analysis tool). The exact statistics computed in these tool are then stored in the product and reflected in all tool windows which require statistics input. This includes the colour manipulation window.
QGIS (and GDAL under the hood) are doing more or less the same. This is why you can notice subtle differences in the min/max values. In QGIS you can also ask for generating the actual statistics instead of the approximated ones (in the layer properties, tab Style).
Yet another difference can come from the JPEG2000 implementations you are using. Depending on your installation, GDAL may still use Jasper as the JP2 codec (it shouldn’t, this is unmaintained software with known bugs).
From your numbers we see that the statistics from a Kakadu decompression and an OpenJPEG decompression are the exact same in SNAP 3.0 (min : 1662 - max : 14254). This is all we need.