When running the TOPSAR tutorial using the exact dataset specified, namely:
S1A_IW_SLC__1SSV_20141103T195043_20141103T195057_003122_00395A_F396.zip
S1A_IW_SLC__1SSV_20141127T195042_20141127T195056_003472_004117_2B48.zip
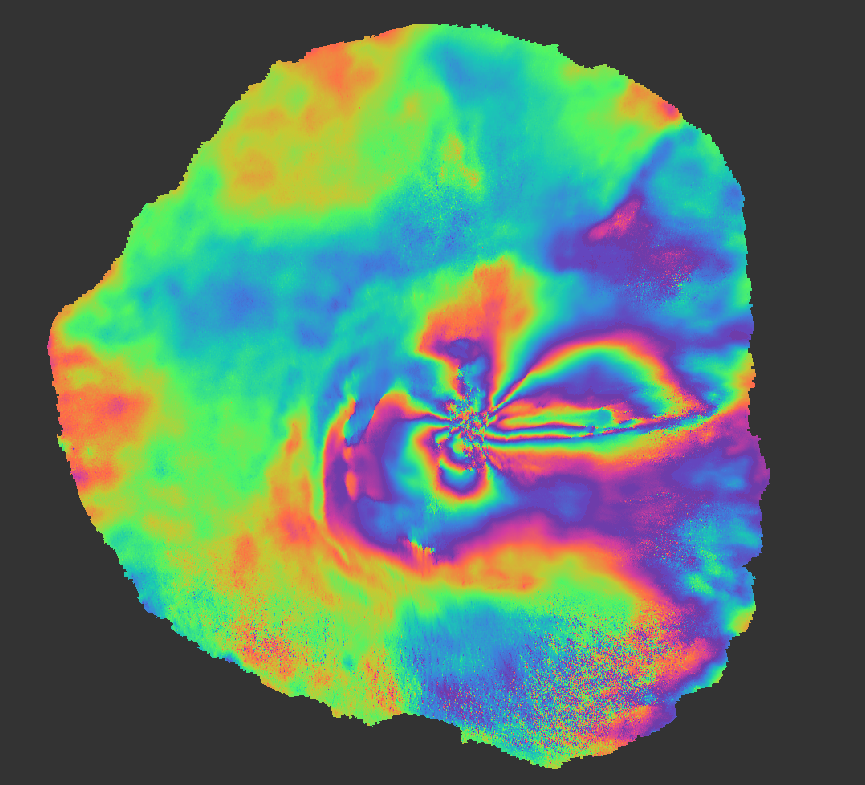
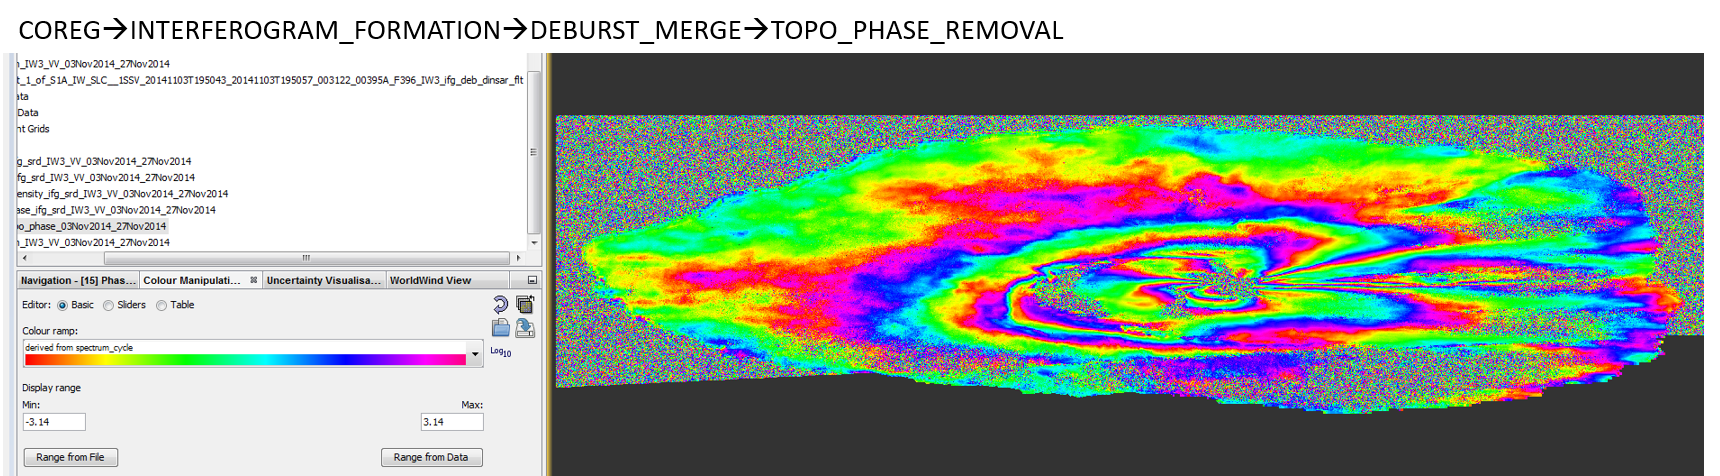
the interferogram generated has many more azimuth fringes than shown in the tutorial result.
They carry through all subsequent steps (debursting, topographic phase removal, filtering).
These results were generated using SNAP v2.0 beta 04. Is it possible that a new bug has been introduced causing these azimuth fringes, or could we have run the tutorial incorrectly. Has anyone else run into the same problem?
As a “newer user” I was not allowed to upload an image illustrating the bursted-interferogram fringes.
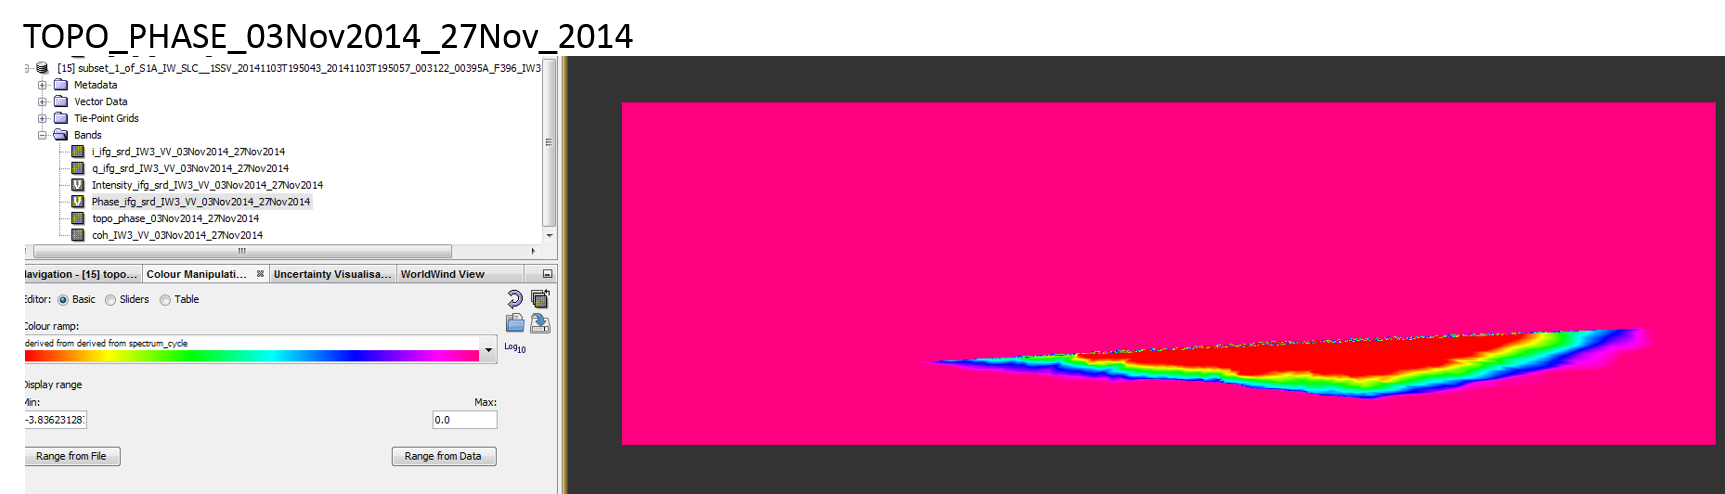
Hey! came across this post and wanted to see if I get these azimuth fringes when the same dataset is tested on the Snap 02 beta 07 toolbox, and what I found is a little abnormal. Here is what I did:
I followed the very same steps as in the TOPS Interferometry tutorial. The good news is that I do not see any azimuth fringes in the interferogram. The bad news is that my topographic phase product (topo phase) looks like this:
I followed the same steps as the tutorial, and I have not masked the sea (as seen).
I would be happy to know if this is what the rest of you get as topo_phase!