Correlation GPS/INSAR

Hi, I would like to plot the correlation between GPS stations and the interferogram. In that purpose, I would like to extract the value on the interferogram corresponding to the GPS station (lat lon). I can’t manage to import a text or csv file with the coordinates in the pixel extract tool. Is there a way to o this with SNAP ?

Thank you

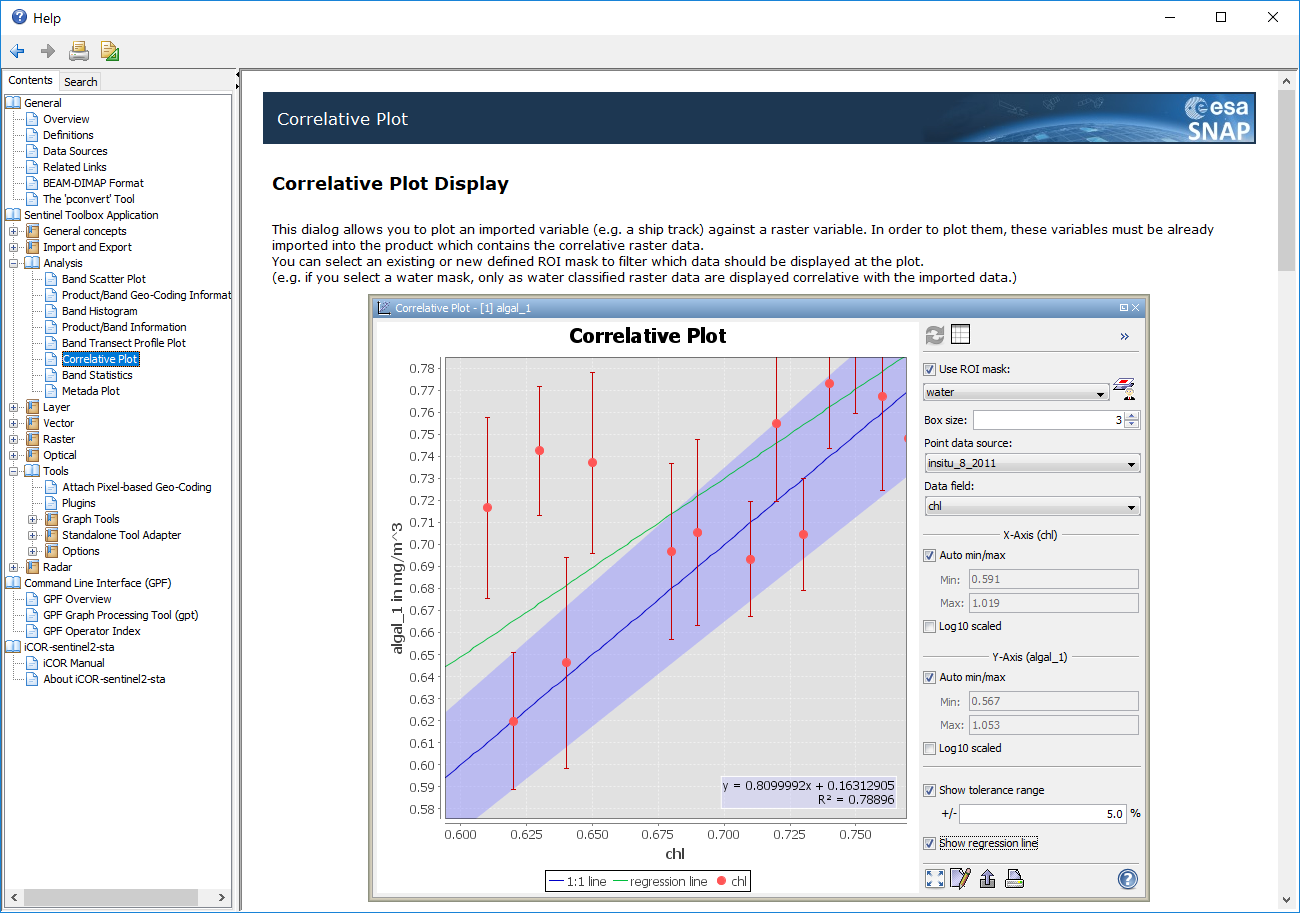
If you convert the GPS points to a Shapefile (with an attribute colum which stores the measured displacement) you can import it into SNAP and use the Correlative Plot tool.

1 Like

To convert your CSV file into a shapefile, QGIS enables you to do it :

Layer -> Add Layer -> Add Delimited text Layer…

Then you go back to SNAP

Thanks for your answers. I create the shapefile yesterday but when I open it in SNAP I don’t get anything. Do you knowhat could be wrong ? (I add the shp to this post)gpsshp.shp (2.0 KB)
Regards

Shapefiles consists of minimum 4 files. You only gave us one

gpsshp.cpg (5 Bytes)
gpsshp.dbf (22.2 KB)
gpsshp.shp (2.0 KB)
gpsshp.qpj (257 Bytes)
gpsshp.prj (143 Bytes)
gpsshp.shx (652 Bytes)

Sorry

Your files are ok. You should be able to import it in SNAP.

You must have a band in your project, otherwise your import modules will be grayed out.

Then, just follow the integrated help of SNAP correlative plot

Thank you for checking the shapefile. I will keep trying.

Hi,

Could you tell me if to plot the correlative plot between an unwrapped interferogram and GPS, the unwrapped band has to be converted with “phase to displacement” ? The result I got are really different from the GPS, at least an offset of 10.

Regards

is your displacement already geocoded with Range Doppler Terrain Correction?

Yes I unwrapped, applied the phase to displacement and Range doppler terrain correction

Also is it normal that there are no parameter to select on the phase to displacement ?

yes, it uses the wavelength and the incidence angle to convert the phase to a metric unit. Nothing to change here.

Regarding the geometric accuracy: If you are using Sentinel-1 data, you should be aware that the native spatial resolution was lower than 10 meters: https://sentinel.esa.int/web/sentinel/user-guides/sentinel-1-sar/resolutions

what I mean is that I don’t have anything on the parameter page, blank page

I am using ERS2

yes, that is the case.

grafik