Hi everyone,
I have done the RADAR VEGETATION INDEX process by using the formula 4VH/(VV+VH), after that I need to extract RVI value for my different fields,can you please help me to extract RVI values for my fields, and also I have done RVI for the time series images, now I need to plot RVI Vs time series images, I’m requesting you to please suggest me the process.
you can either digitize polygons for your fields or place pins. In a second step, you use the time-series plugin to extract and display temporal measures as described here: Time Series (Temporal) of NDVI
I’m trying to do RVI for time series images, by using RVI=4* VH/VV+VH this formula, I’m getting some outputs, but I don’t know whether it is right or wrong. Sir kindly please help me, how we will calrify that.
is the RVI will come same as NDVI??
It will not completely replace NDVI because it is based on surface characteristics (mainly the ratio between cross-polarization and co-polarization) instead of the chlorophyll concentration.
But similar to the NDVI higher values indicate higher vegetation presence. It is quite a relative measure with no distinct minimum or maximum.
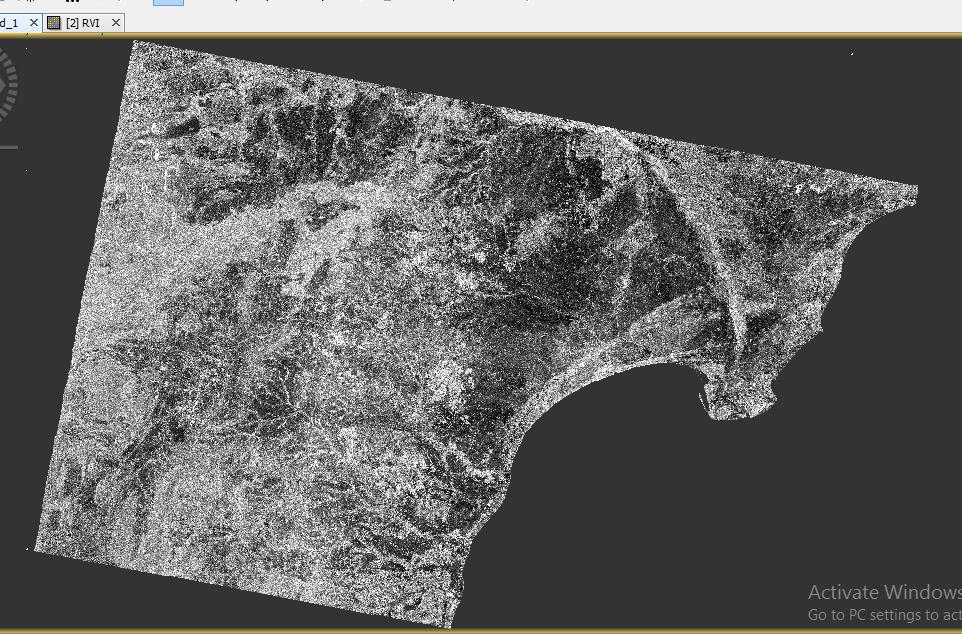
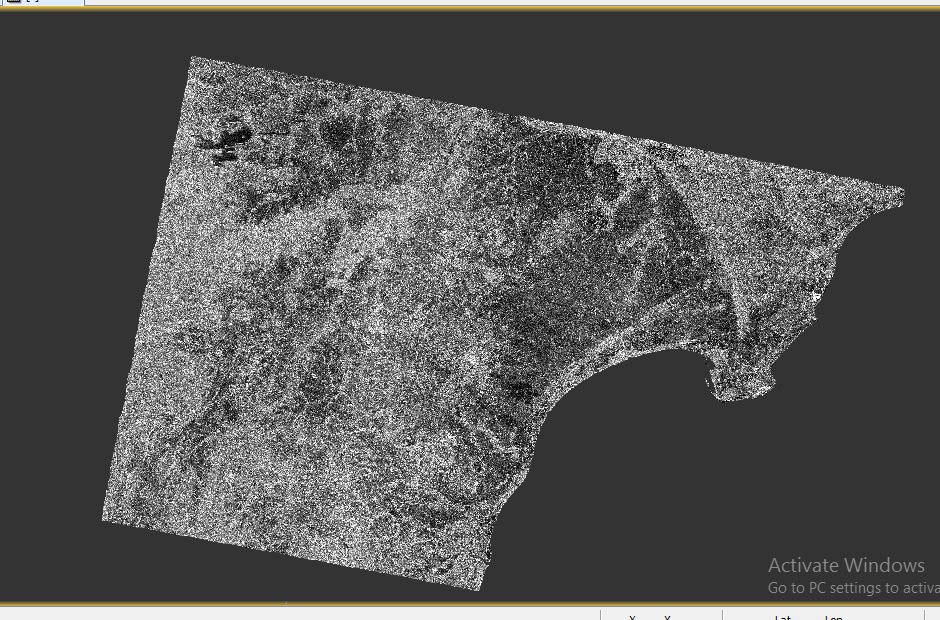
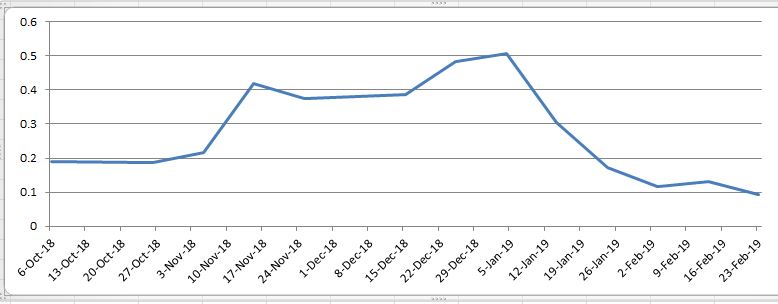
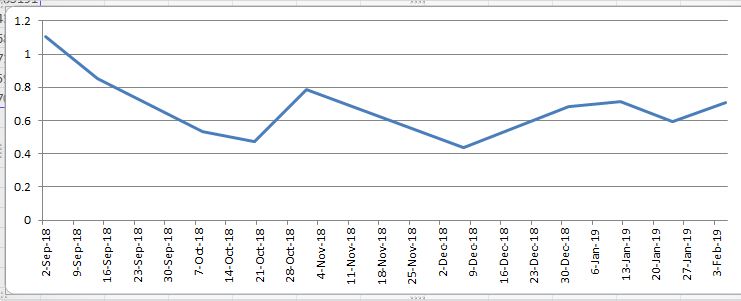
these are the outputs I got,Sir RVI is fully opposite to NDVI. I have done this process for Sunflower crop,these are the steps I followed
1.speckle filtering(Lee filter)
2.Radiometric Calibration
3.Geometric terrain corrections(DEM : SRTM, resampling: Nearest Neighbourhood)
4.Band maths (4*VH/VV+VH).
sir is it right or wrong, if wrong means please help me sir to get proper RVI
I’d say there is no right or wrong.
If you technically derived the index according to the published equation (make sure to set paranetheses around the numerator and denominator), the index is correct.
While for some vegetation it might match the variation of the NDVI, it coudl be different for others. It is important to understand that all information derived from SAR backscatter originates from roughness, size and orientation of the objects or surfaces within a pixel.
I can’t read it and don’t know if it is a suitable measure but you can simply open the band maths by right-clicking on a raster and select “band maths” and enter the expression there.
And dielectric constant (moisture)… That’s the real issue. We are running some test. NDVI,RVI and EMSI. There is probably no correlation, however we are using Sentinel 1 images and formula created for RADARSAT images, so one would that formula need some modification. It also seems to us that it very much depends on ascending or descending position of satellite.