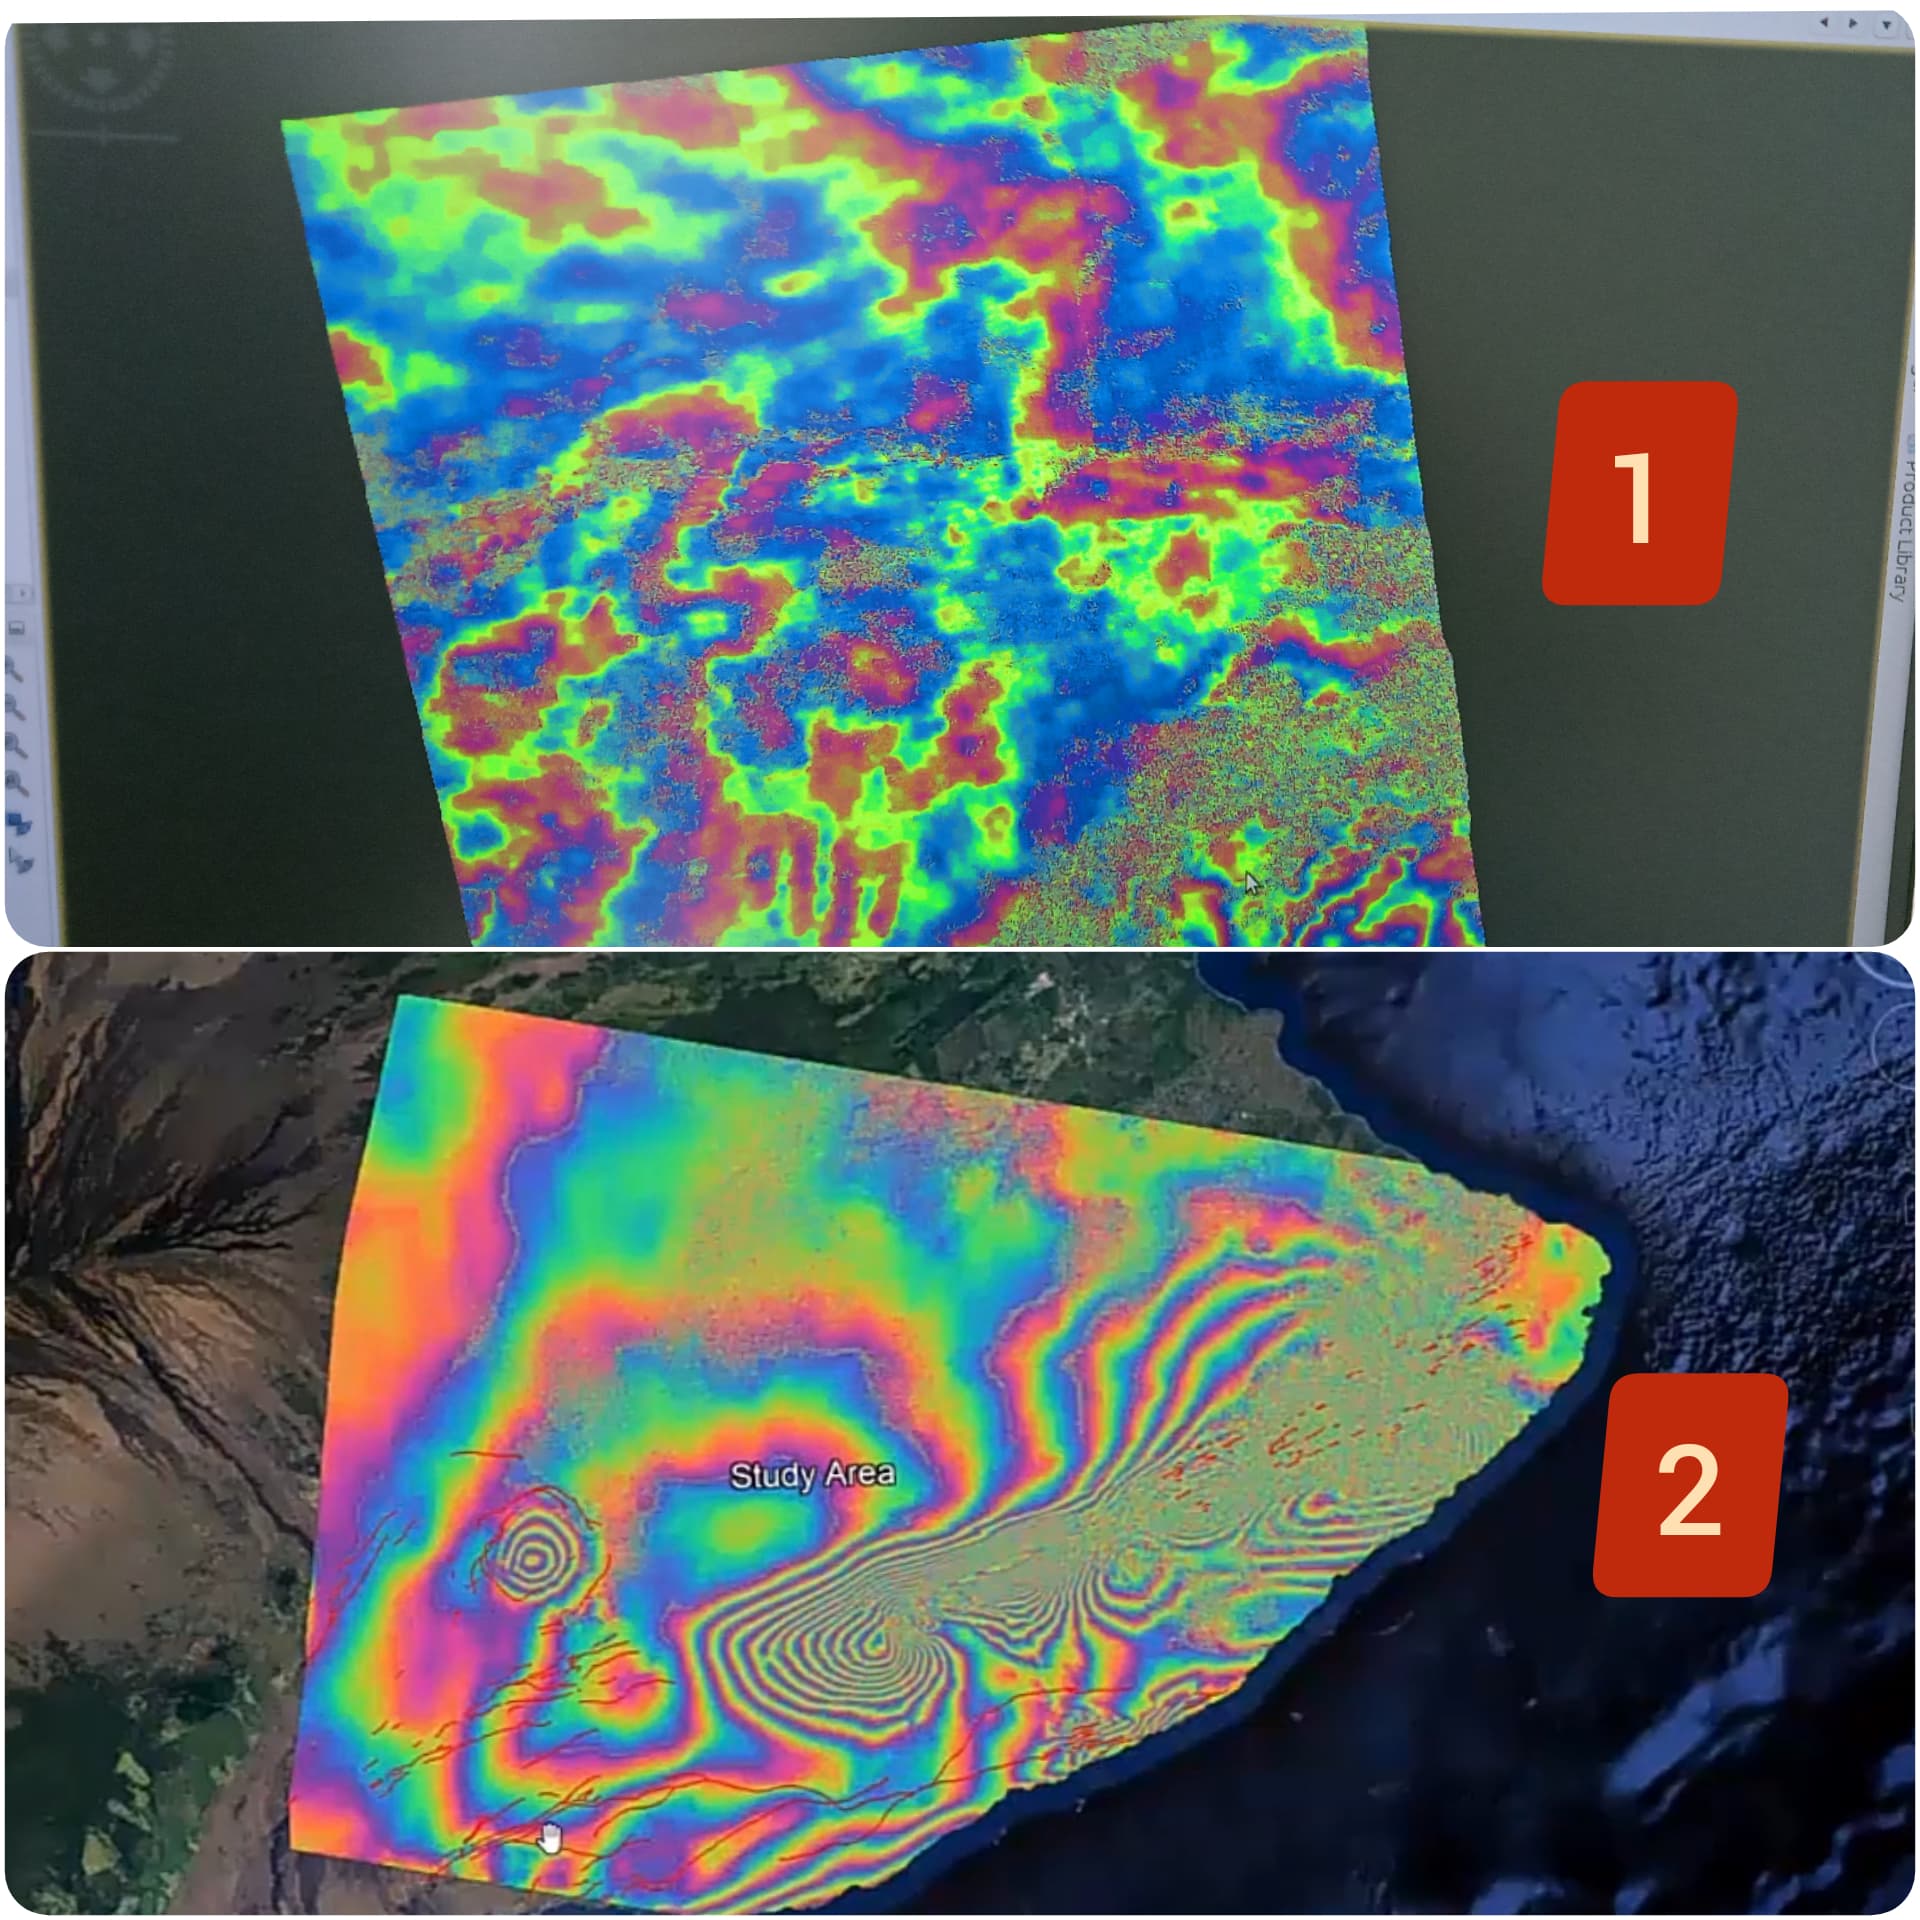
I was analysing an earthquake, and getting phase fringes like fig (1) but when I’m looking into other papers having fig(2) fringes.
Do I need to apply other corrections?
I’ve applied ML>FLT>TC
I was analysing an earthquake, and getting phase fringes like fig (1) but when I’m looking into other papers having fig(2) fringes.
Do I need to apply other corrections?
I’ve applied ML>FLT>TC
looks like different data was used. Your data has ascending orientation and the second image descending orientation. Are you sure that the exact same image products were used?
Also, I see several patterns of atmospheric disturbance which superimpose the fringe pattern.
Images, location and events are different.
But wherever I’ve researching, I’m getting these kind of (2nd image) fringes for earthquake events.
But in my case, no such deformation is visible on phase though earthquake magnitude is 6.5.
Only earthquakes with a surface movement in the radar line-of-sight direction can cause fringes. Deep earthquakes don’t necessarily do this and sometimes the surface movement is orthogonal to LOS.
Is there any operation which can give us orthogonal displacement to LOS?
If the movement is significant, a sizable fraction of the pixel size, feature tracking might work.
What is the depth of the event you are looking at? Magnitude alone is not very useful. You will see fringe patterns only if the event is shallow/ large enough to produce surface deformation on the order of many cm.
I’m looking at 30Km depth magnitude.
But, deeper earthquake will also produce ground displacement.
Why does it not visible on S1 LOS?
@hchaube Please, provide details on the event and data used, So one may try to reproduce your
problem.
Use a simple simulator, e.g - Pyrocko-GF - Geophysical forward modelling with pre-calculated Green’s functions — Pyrocko v2021.09.14 Manual to figure out how much deformation is expected on the surface. Everything boils down to displacement on the surface.