Hey Guys,
I am using the command line interface with a graph (See below) I built in SNAP using the Graph tool before.
After trying to make the output-filename variable using the write-node in the graph (${target} as name) I realised it didnt work with -Ptarget=ab.tif, so I used -t ab.tif when entering the code to set the target name.
But I got different results for both files. The maximum values differ a lot, mean etc. are also spreading.
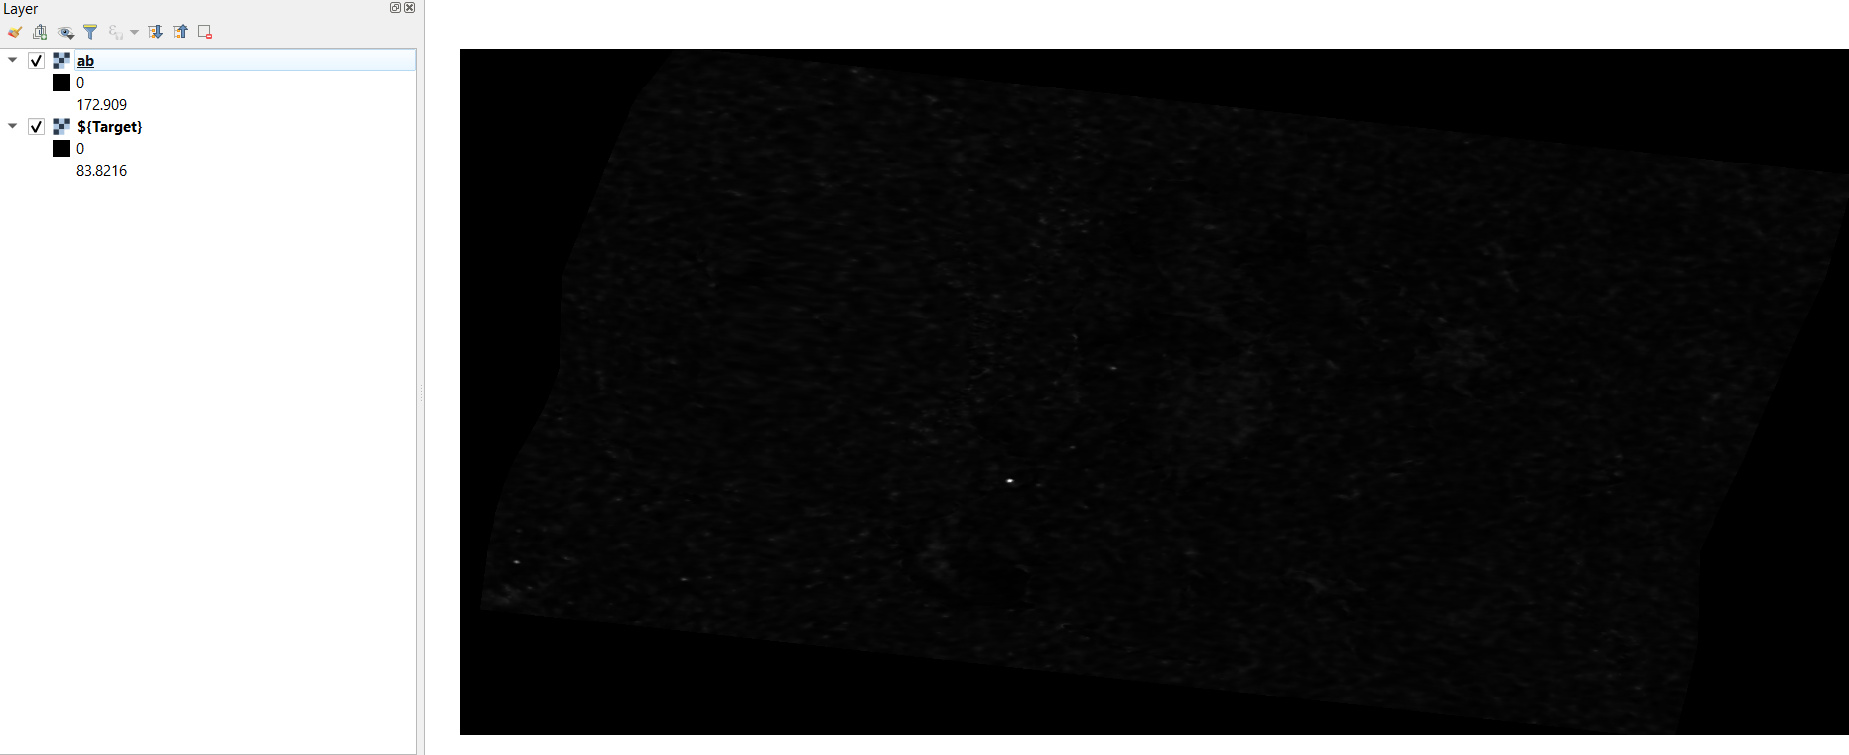
Can someone tell me why this happens? I anything wrong with my setup?
This is the batchfile I enter in my Windows-cmd-window:
gpt GRD_Test.xml -PFilename=S1A_IW_GRDH_1SDV_20181104T054742_20181104T054807_024434_02AD7C_F5E1.zip -t D:\RSIV\Masterarbeit\GRD\Norway\Neu\Preprocessed\ab.tif
This is the graph:
GRD_Test.xml (5.9 KB)