Dear ABraun,
Will it be worth to unwrap these interferograms formed after DInSAR?
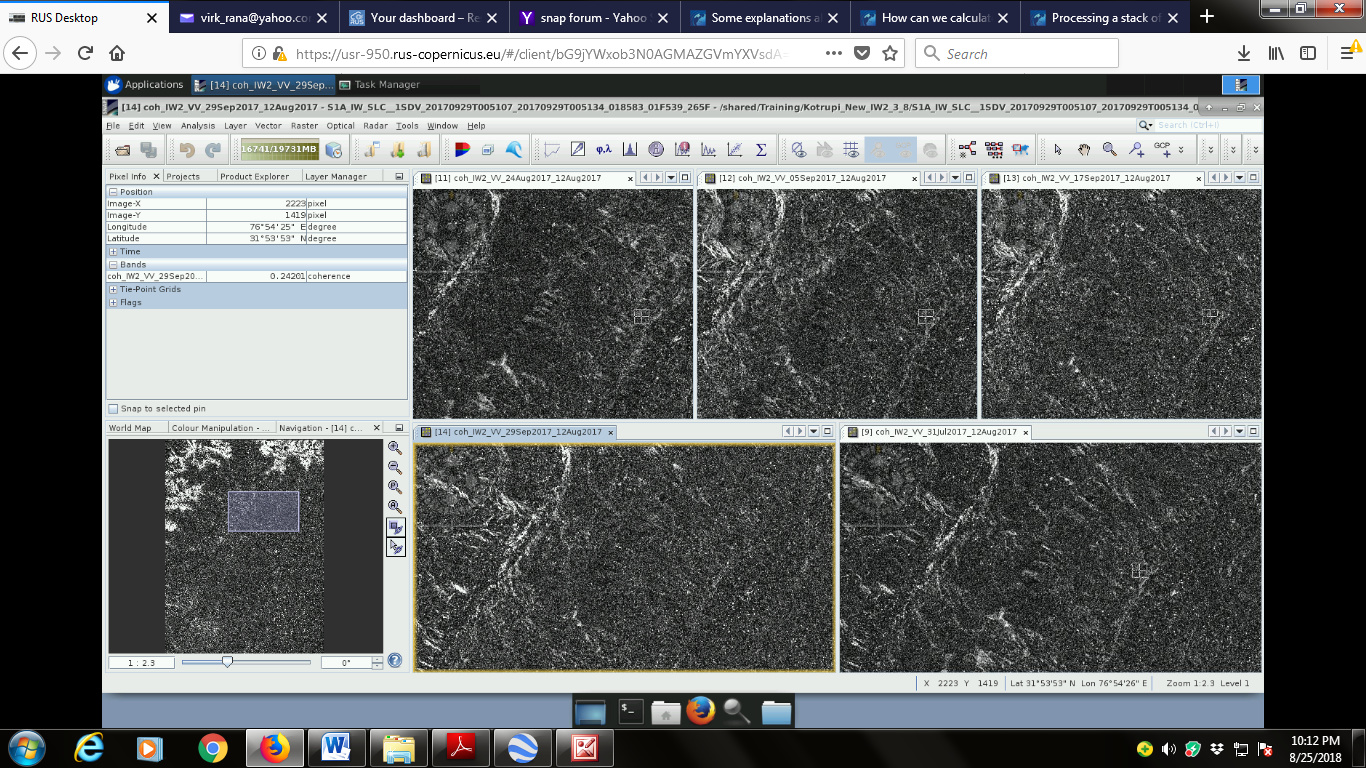
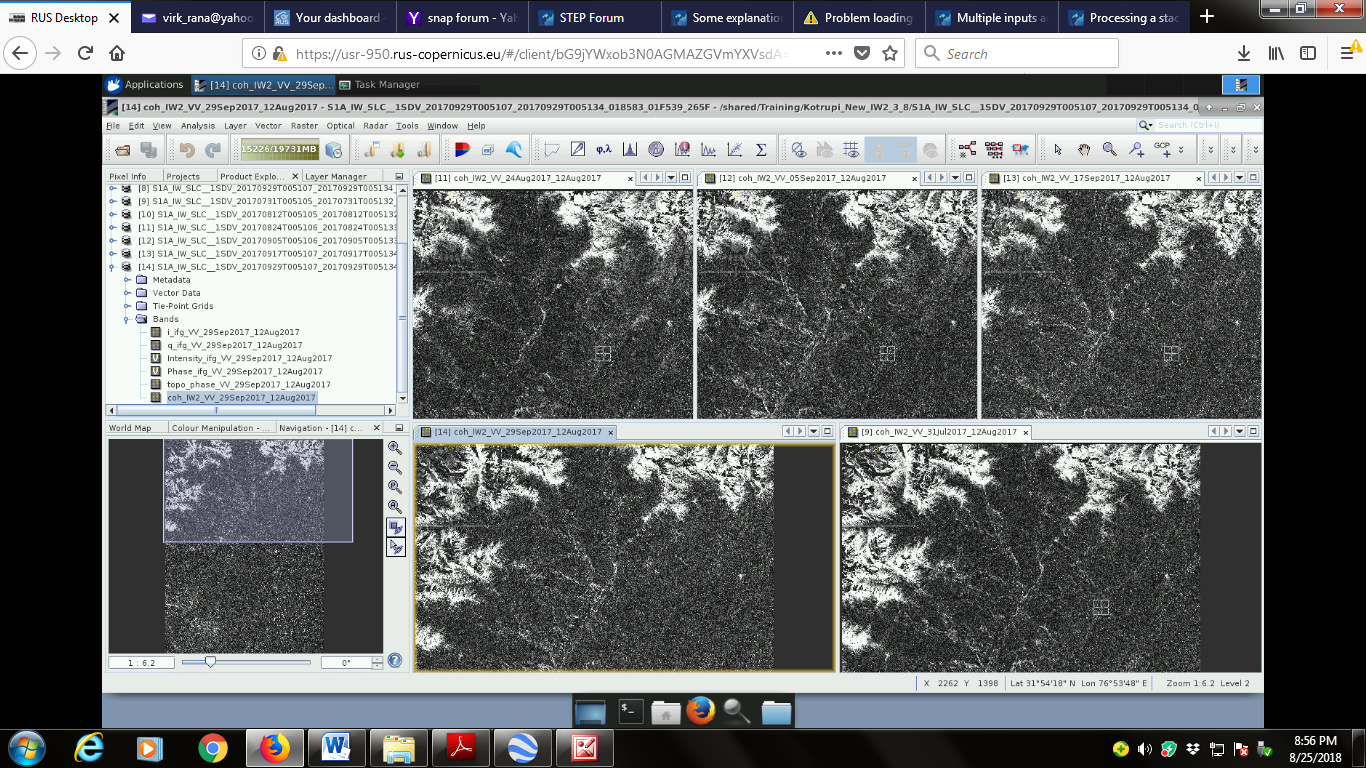
Coherence band of all is shown in screen shot. I wish to find landslide deformation around the cursor point lat lon.
Please guide.
regards ASVirk
Dear ABraun,
Will it be worth to unwrap these interferograms formed after DInSAR?
Coherence band of all is shown in screen shot. I wish to find landslide deformation around the cursor point lat lon.
If you are interested in changes within the white areas, it is worth a try. Given that the white areas range above 0.3. I cannot tell by looking at it, if the areas have high values or if it is just adjusted contrast.
Anything outside those areas is not usable.
A landslide is a non-coherent change, because the backscatter characteristics of a surface (all involved pixels) mostly change. InSAR is only able to measure elevation differences of coherent processes. Additionally, surface differences of the size of the wavelength (Sentinel-1 has 5 cm) can be observed at most per image pair. Anything larger (usually the case for landslides) cannot be measured.
See mengdahl’s comment here
Dear Mengdahl.
Then how can we calculate landslide deformation if DInSAR couldn’t work?
Regards
ASVirk
A suitable method always depends on the size, velocity and and nature of the landslide. Giving general recommendations is hard but there are factors which influcence the decision.
InSAR is not generally impossible, but these are some constraints:
Favorable conditions:
Unfavorable conditions:
I recommend reading some review papers. They often point out the strenghts and disadvantages of classical DInSAR and suggest solutions (e.g. Persistent Scatterer Interferometry [PSI], intensity offset tracking, or combination with other data sources).
@mengdahl
I am currently working on offshore black sand mining and its impact on shoreline retreat. I’m afraid I am using an inappropriate methodology.
I understand that the high coherence of a pixel means comparing the same object detected at different times at the same location. And a low coherence may imply that at the same location, different objects are being detected.
But can’t we consider comparing different objects at the same location? (I mean not entirely different. In the case of sand, maybe THE SAME KIND OF SAND but different set of sand. The sand is affected by sediment redistribution, but I am sure that they are the same kind of sand.) Please help, I’ve been following your replies on multiple threads to understand this new topic.
as I understood the approach you referred to: They use coherence to determine the boundary between water and land (shoreline). They do not use DInSAR to measure the altitude change for this time, instead they use image pairs of very short temporal baseline (1 day) to calculate the coherence as an indicator for the current position of the shoreline.
With an a-priori knowledge of the shore’s topography they estimate how much the shore has retreated and relate that to a vertical level.
How about this study: https://www.researchgate.net/publication/269546921_Detecting_the_Amount_of_Eroded_and_Deposited_Sand_Using_DInSAR
They used DInSAR to monitor height changes in desert areas.
What do you think are some of the considerations when using DInSAR to quantify coastal erosion? Or should we really not use DInSAR when analyzing sediment redistribution?
I have already processed 5 pairs of images. I supposed to use PSI, but I lack time to study it, and its difficult to follow for a beginner. So I planned to process consecutive pairs of images (AB to BC to CD… so on) to identify the displacement over time. Until I discovered this thread. Seems like my methodology is non-sense. Please help.
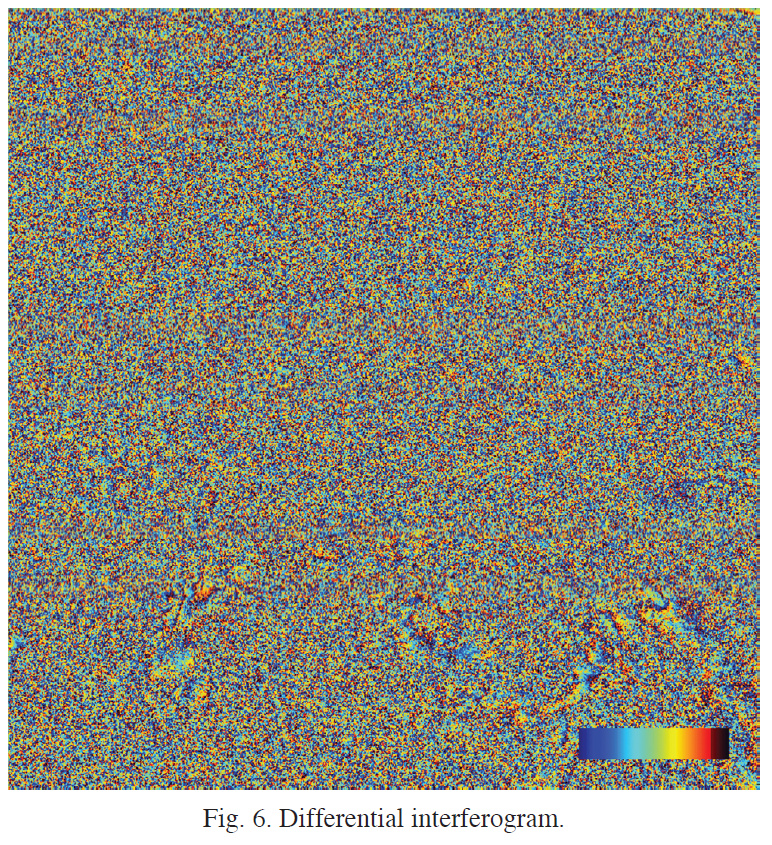
I think it is highly dubious to retrieve deformation rates from a single interferogram that looks like this
The surface changes of -160 to +120 cm as mentioned in the abstract cannot be measured by a single ENVISAT pair at all. Most of the area is just accumulated random noise in the interferogram.
Please anybody comment if I see this too negative, but in my opinion, most of the deformation patterns are probably caused by atmospheric contributions. I don’t see a chance for proper phase unwrapping here.
Sir @ABraun, if they shouldn’t use the displacement map generated from DInSAR, would it be more appropriate if they compared the generated DEM throughout the years and compare the changes in elevation as a measure of the vertical displacement?
if this is the interferogram, you cannot derive a valid DEM either. It makes no difference in the end. Without good coherence and proper fringes you cannot measure topography or its changes using DInSAR.
Dear Sir @EJFielding,
I am planning to perform single-pass InSAR. Would you recommend a workflow on how to do this in SNAP? OR is it just the same as that of repeat-pass InSAR?
Sorry, I wasn’t aware that you have single-pass data. This can make a difference regarding the questions you asked above. What sensor are you using?
No, I was just planning to change my workflow because of many limitations of conventional DInSAR. But I will not push through because the data are expensive.
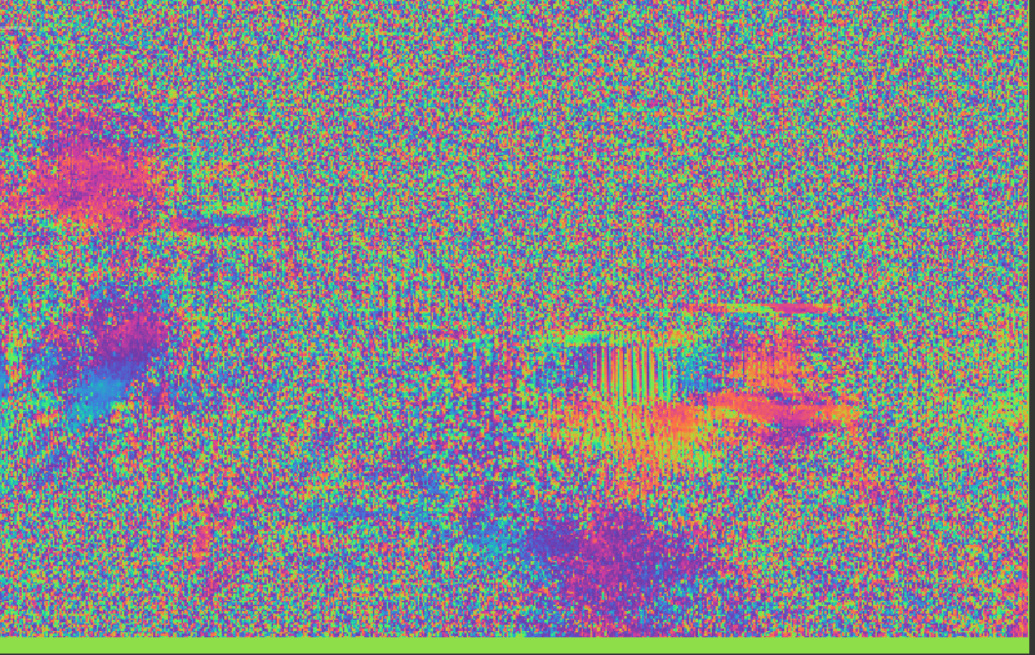
Am I right that this interferogram is composed mainly of noise? Or can this be used to measure displacement? (only on some specific parts)
To retrieve reliable information, it should at least look like figure 24 of this tutoria: S1 IW InSAR
In its present form, the unwrapping will produce random results which cannot be translated into metric displacement, I’m afraid. If you only have small patches of high coherence, as in your case, one solution is persistent scatterer interferometry (StaMPS or LiCSBAS)
any loss of coherence is bad for InSAR (also StaMPS), but chances to retrieve usable information is higher because only persistent scatterers are analyzed which maintain a stable phase information over a longer time.
The example from the tutorial is also in a mining area. I am not sure about coastal erosion, because this is probably a more disturbed environment.