alright, so you can go on in Linux now.
Dear thho,
I have completed Katherine’s workflow upto point 8. Please help me to understand step 9 and further StaMPS processing…
Regards
Dear @virk_rana,
currently there are many workflows about this topic out there, can you link to the one you are using? Maybe I can help you then. Concerning StaMPS processing: This is highly case study dependent, I recommend to read the literature linked below to understand StaMPS and its parameters. Technically, running StamPS in Matlab is straight forward, follow the manual linked below.
2 Likes
Yes i have read some of these. I have successfully processed sentinel 1 data for subsidence detection already and chosen these stacks accordingly.
Actually i am on a VM installed with SNAP,QGIS,BRAT GUI,R-studio etc. StaMPS and Matlab are not being traced by me there.
Asked VM providers to help me too.
Hello bayzidul
In step 13: (How to prepare Sentinel-1 images stack for PSI/SBAS in SNAP)
«mt_prep_gamma» is executed by what software?
Where?
How?
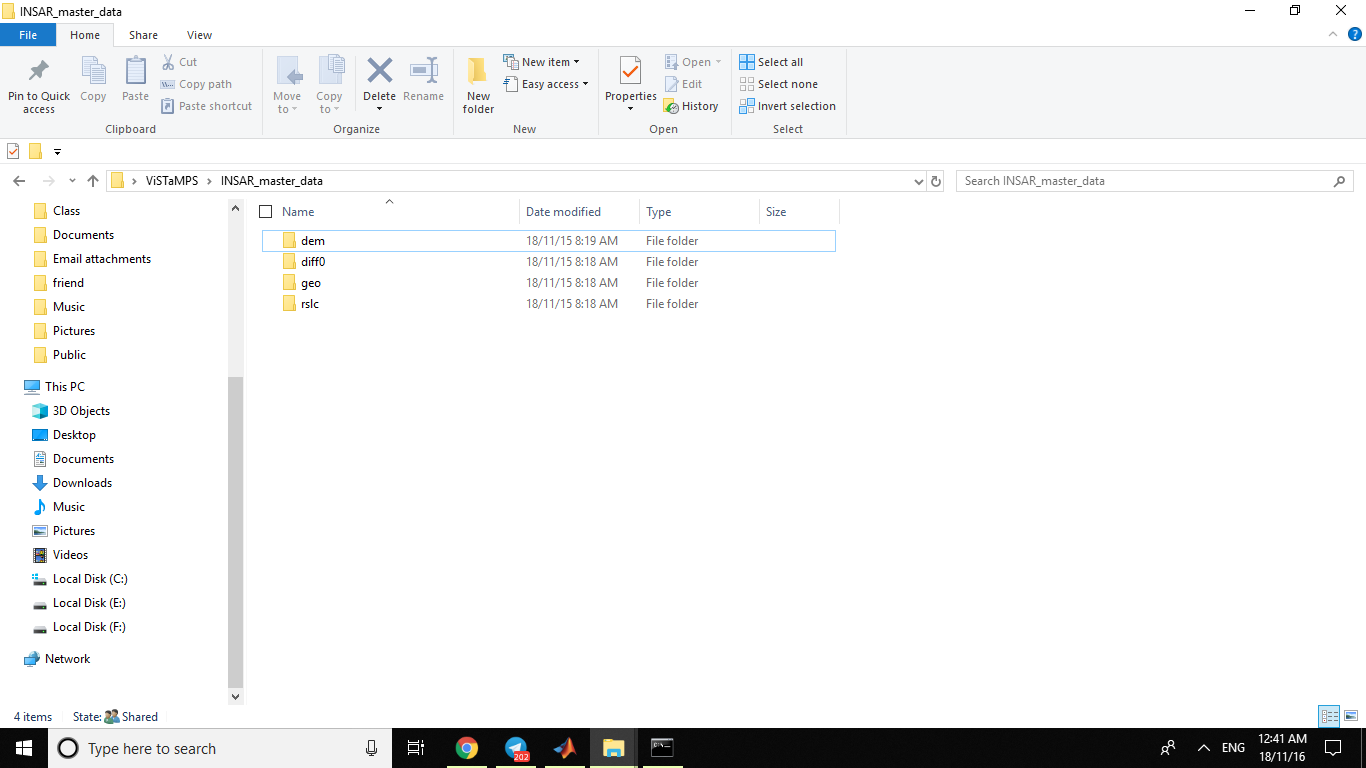
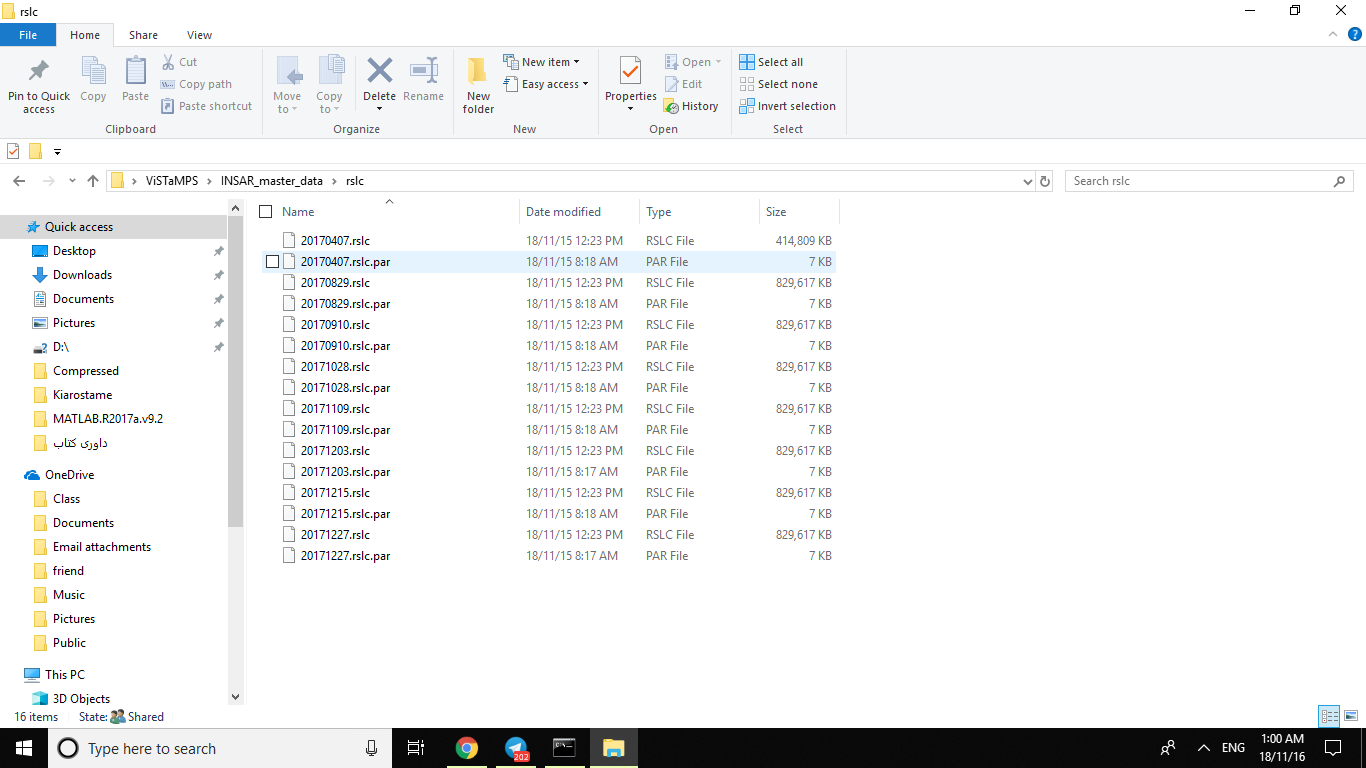
Below fig show main folder (INSAR_master_data)
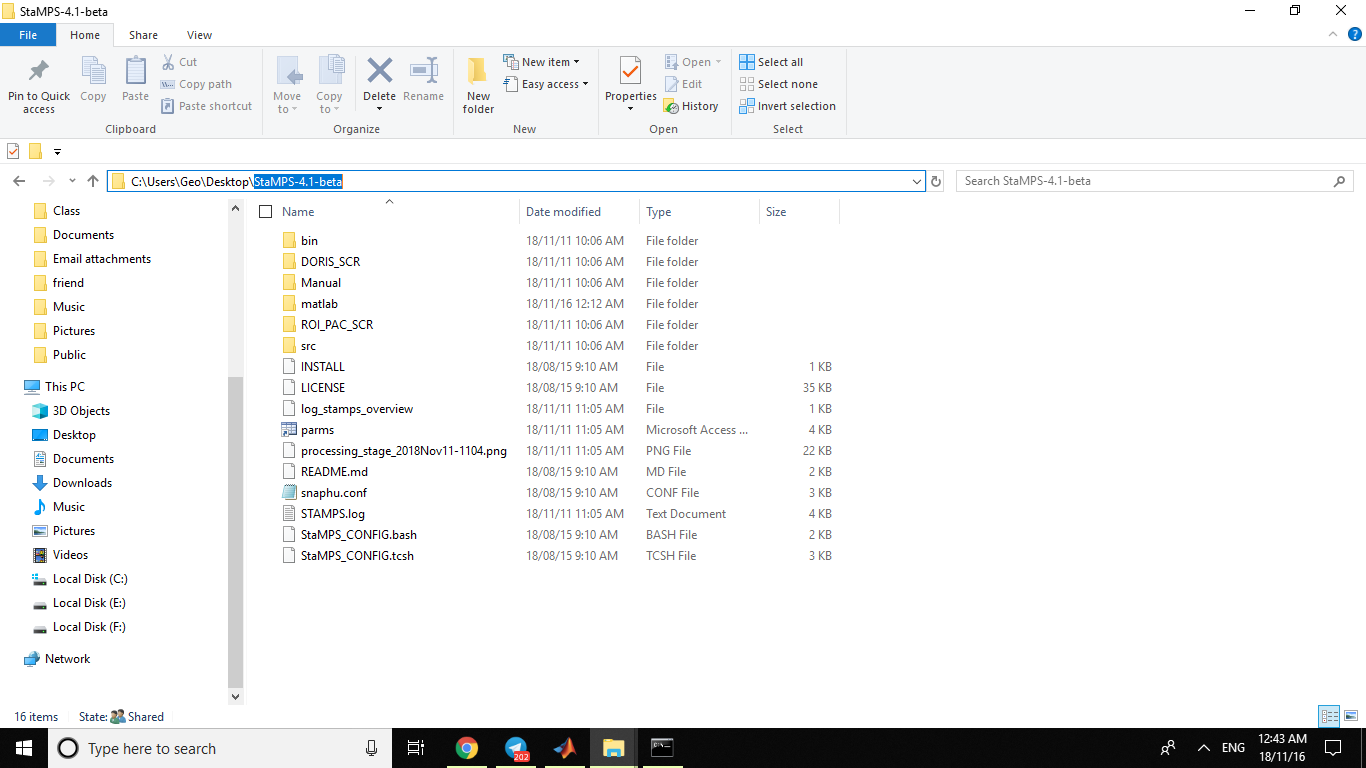
and below figs show StaMPS-4.1-beta folder
===
dem:
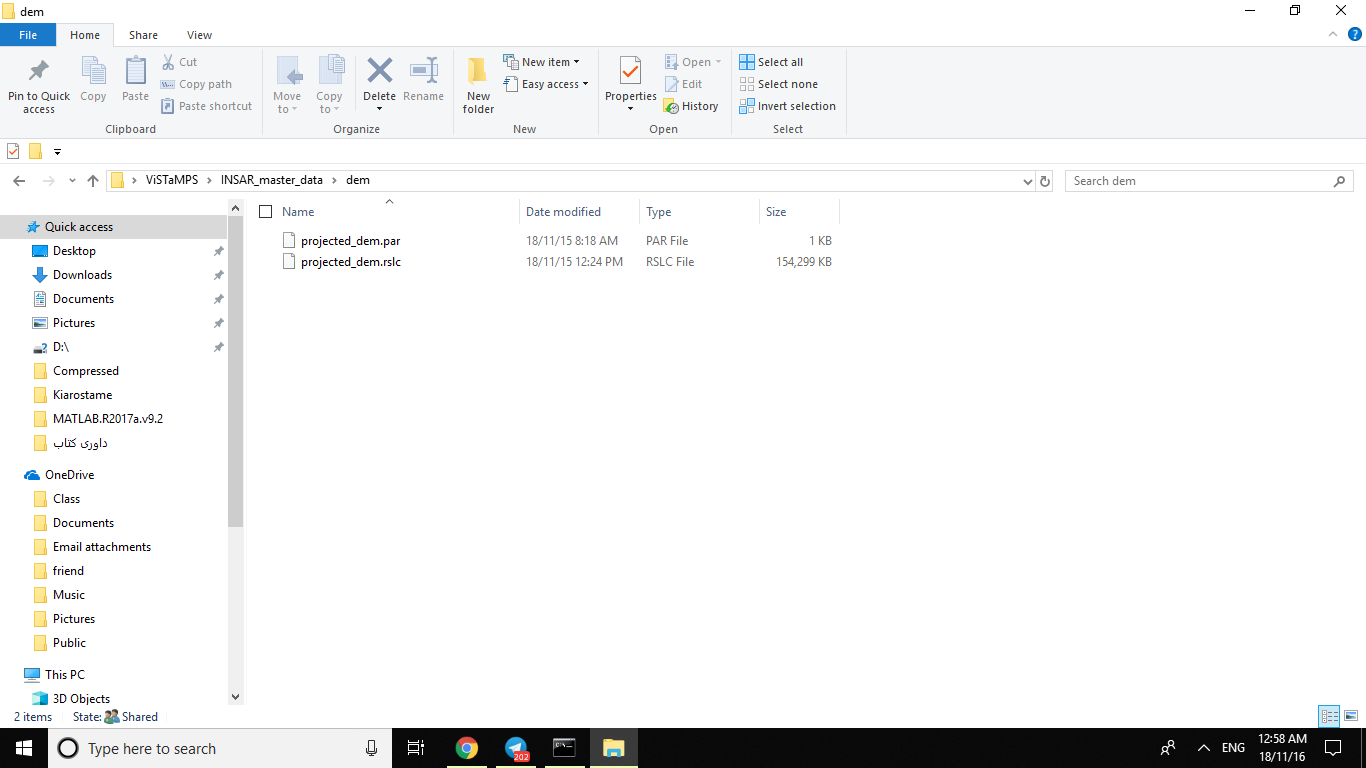
===
diff0
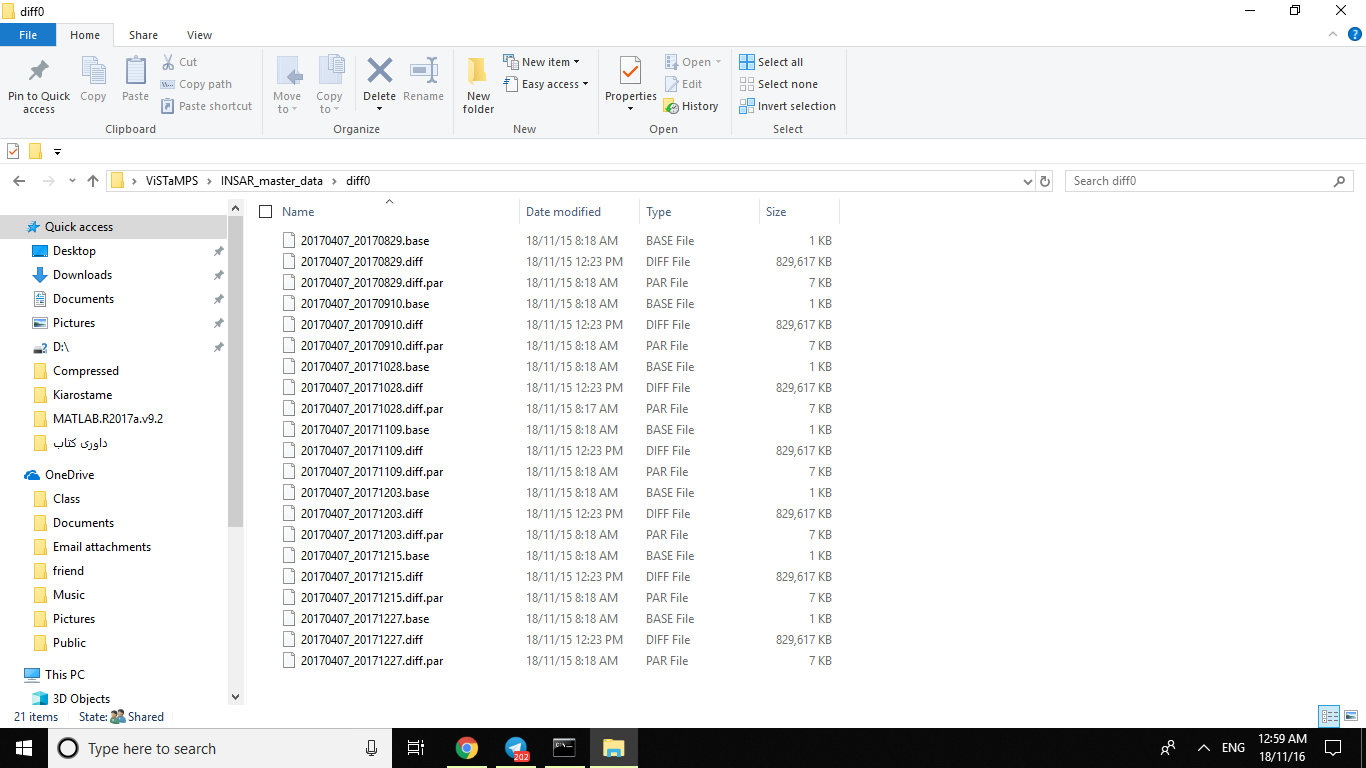
===
geo

===
rslc
thanks
You open your linux shell, source the config file as described in the manual and then navigate to a new working directory (at best empty) and run the command pointing to the folder where you exported the data from SNAP. The files will be created there.
Please have a look here: How Can ı Run mt_prep_gamma script in Cygwin for PS/Stamps application? Help please!
Hi ABraun
Can not I run it in Matlab software?
Copying, and transferring the folder(INSAR_master_data ; about 13G) takes a lot of time?
Thanks
These are the required steps:
- prepare all stacks and interferograms in SNAP and export them
- run mt_prep_gamma in a Linux shell to make them readable to Matlab
- use the StaMPS matlab scripts to process the persistent scatterers
That’s right, I did it. but below error(command not found)
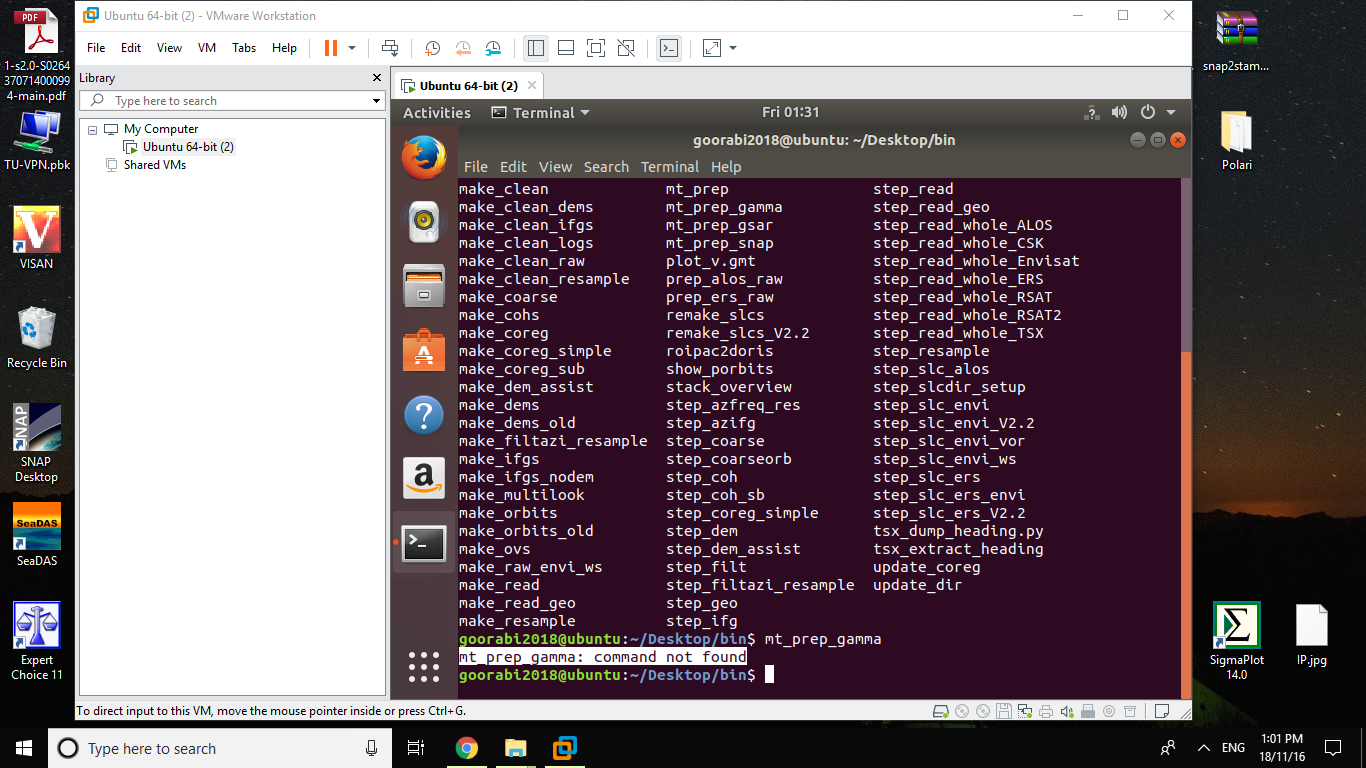
In the top posts, pointed to a lot of errors, When we execute the commands.
What is the best version of StamPS? have had the more less error
thanks
Hi, dear all.
I am very confused how to compute the deformation maps from the unwrapped and corrected phase using StaMPS, a suggestion is to change the StaMPS Matlab source code called ‘ps_plot’, just add the codes like these, ‘ph_all =-ph_all*55.5/4/3.141592653’, is it correct? And is there anyone having drawn the deformation map of each slave image referenced to master image?
Thank you a lot!
actually, the StaMPS scripts do all that for you without the need for any adjustment.
have a look at chapter 4 of this tutorial: http://seom.esa.int/landtraining2015/files/Day_4/D4P2a_LTC2015_Hooper.pdf
It shows many ways of plotting single images and pair-wise deformation maps.
Also a very good source: https://www.unavco.org/education/professional-development/short-courses/course-materials/insar/2016-insar-isce-giant-course-materials/Hooper_Lecture_PS.pdf
 I’m very happy that you have shared such wonderful sources, it’s helpful, especially the last one which I haven’t found. But commands about plot at chapter 4 are mainly to draw phase maps instead of deformation, and ps_plot(‘v’) or ps_plot (‘v-d’) don’t show the deformation between the master image and slave images. I don’t know whether is correct to add sources like ‘ph_all =-ph_all*55.5/4/3.141592653’, means change the phase to surface deformation. Thank you a lot!
Now I understand. I haven’t tested it but the actual equation to convert the unwrapped phase to elevation also involves the incidence angle.
(unwrapped_phase * wavelength_in_mm) / (-4 * PI * cos(rad(incident_angle)))
But I am not sure how these variables are already present in Matlab. Where did you find this equation?
I currently have no access to StaMPS but I will have a look if there is a plot_command to show all pairwise displacements in one map.
Thank you again, ABraun! The equation ‘ph_all =-ph_all*55.5/4/3.141592653’ is to compute the LOS deformation, I think it is the same with yours, but I use the specific values to replace the variables, such as wavelength_in_mm replaced by 55.5, although I don’t know it is appropriate. And ‘ph_all’ in StaMPS Matlab source codes is stand for a array stored the phase of all interferograms.
sure, I was just using variables, but I am still missing the last part on the incidence angle.
I didn’t find one to be honest. All plots created with ‘v’ only show the average displacement so you might in fact need to derive it from the unwrapped phase (‘u-dmos’ is the unwrapped phase minus dem error, AOE, orbital ramps and topo-correlated atmosphere)
I have finieshed all the process in this part and get a displacement with 10 infer image,now i want to add the data to 30 image, when i do he step(ifg),the process is really long and when i get to about 70% of inter, an error occurs.i want to know the reason,first i think it is becasue the too manny images,may i need to creat two more stack to process,can you give some advice
What’s the error message?
Hi, ABraun, thanks for your suggestion.I will try it.
i forget it ,because the inf process stay almost 6 hours,and the error occurs,how can you process data (over 20 imgas),do i need two creat two more stack?