there seem to be patches which have a very little amount of PS, which can have two reasons
- there water bodies in larger parts of your data
- the patches cover small areas., then you could reduce the number of patches in the mt_prep command
there seem to be patches which have a very little amount of PS, which can have two reasons
Thank you very much, Mr. ABraun.
Thank you for your guidance. I will test it. I hope we can discuss it further.
I just started using stamps recently. Can you give me some advice on parameter facilities.
For example, a set of universal parameters for high coherence large-scale deformation monitoring.
Thank you very much!
Hi @SJ-RS,
setting StaMPS parameters is quite unique to your study site. However, for a start you can have a look into my thesis. What I did might resemble your application, I reported the most important parameters on pages 42 and 54
Maybe that will help you as a starting point!
Thank you very much, Mr. thho.
I will carefully study the documents you provided.
Dear Mdelgado,
Is it Enhanced Spectral Diversity step present in this script or not? Because I didn’t find it in python code.
Thank you.
yes, it is contained in the coregistration script which calls the XML including BackGeocoding and ESD
Dear experts
I encountered some problems running step (1,1) of stamps-sbas:
Index exceeds matrix dimensions.
Error in sb_load_initial_gamma (line 146)
bl=mean(sort_x(1;n_pc,:)); %bottom left corner
Error in stamps (line 221)
sb_load_initial_gamma;
I have no problem in PS; I don’t know what’s going on. Can you give me some suggestions?
I’m looking forward to your reply.
Hi CDE,
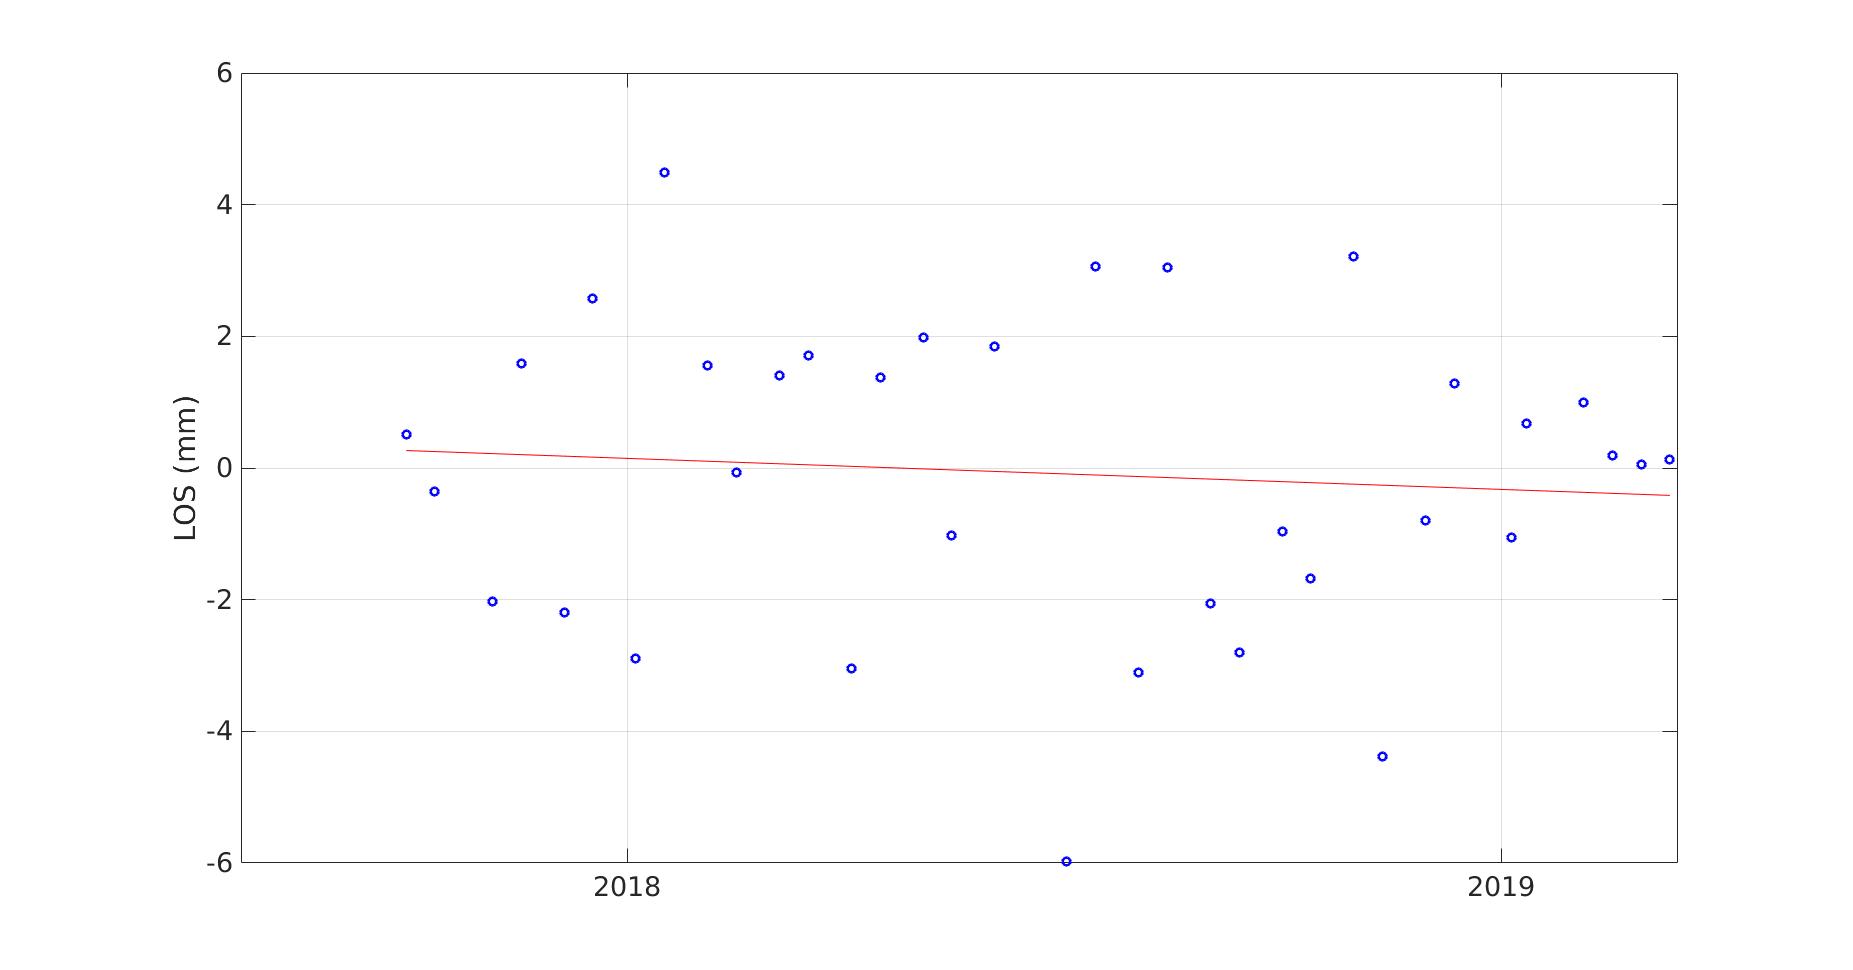
This was a figure I have done during my PhD and I don’t have it anymore.
And so far, I do not have found a satisfactory answer to explain this dispersion on my Time Series.
Mean LOS velocities, essentially vertical in my case, were coherent with the time evolution of the monitored phenomenon (residual mining subsidence).
Atmospheric corrections with weather data and analytical correction (from TRAIN software) has been tested, but the dispersion persists …
A colleague of mine had the same problem of dispersion in the TS while studying Egyptian area.
Cheers
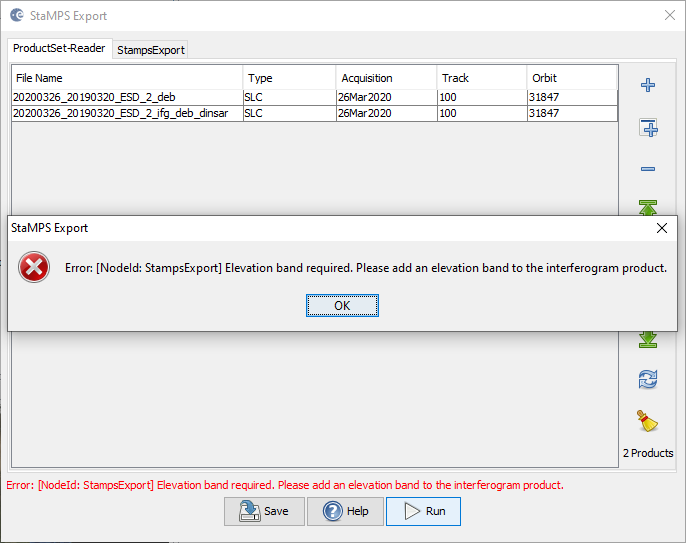
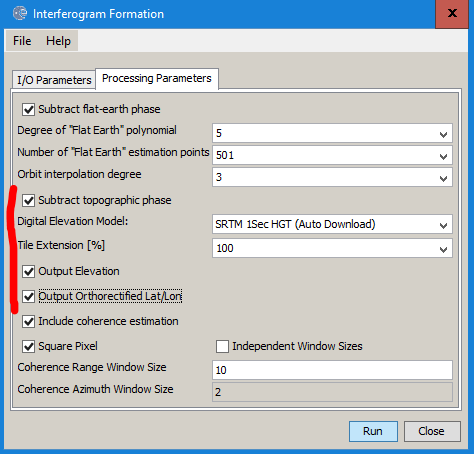
I am trying to export my debrust and dinsar debrust image for PSI processing in STAMPS but I am getting this error. Kindly help me how I can resolve it?
please make sure to select “topographic phase removal” in the interferogram operator and select “output elevation” and “output latitude and longitude”
hi all
pardon me, for i have a beginner question and could not find the answer
so i know that sentinel 1 SLC has pixel spatial resolution which is 2,7-3,5 meter in range direction vs 15,5 meter in azimuth direction,
so after i have done the ps insar method, i obtain deformation rate value in geometrically corrected image, so my question is what is the pixel spatial resolution for the result ? since i couldnot find the parameter in StaMPS
thank you for your answer and time
oh one more thing,
is there any sattelites recommendation to do PS interferometry SAR for years 2010 or before sentinel 1 exist ?
ERS and ENVISAT https://esar-ds.eo.esa.int/oads/access/collection
The spatial resolution of PS approaches is different from the pixel resolution because the time-series approach allows to locate the scatterers at sub-pixel precision.
Some general remarks are given here: Persistent Scatterer localization and prediction technique
More details are presented in this review paper: Recent advances in SAR interferometry time series analysis for measuring crustal deformation
I’m quite sure that there is a way to find out the spacing of the PS in StaMPS/Matlab, maybe someone in here knows it.
thank you for your valuable answer Sir ABraun,
i will read the papers you recommend first, and if i am still stuck maybe i will ask a question again to make it clearer, (hope you guys dont mind)
regards,
that’s what this forum is about 
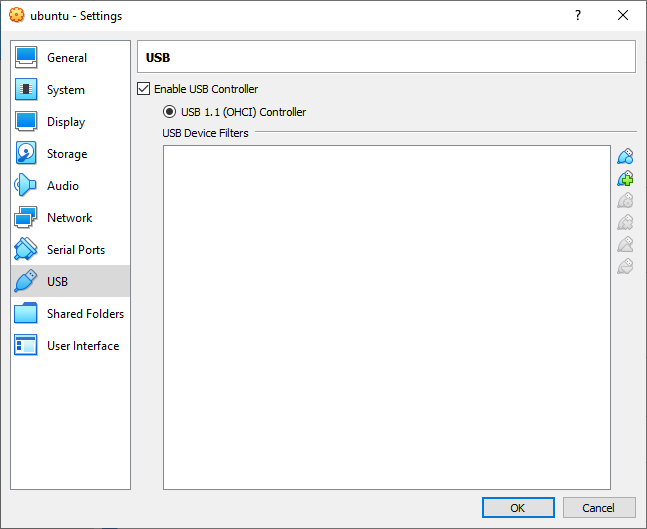
Thank you for your valuable time. It works Sir! Now I am stuck with my virtual machine as I am naive in this OS. I have done my Stamps Exports in SNAP(Windows) and now for Stamps, I am trying to connect my hard drive 2.0. I am unable to attach my drive to my virtual box as there is no option for it in my system. Can you help me in this regard? waiting for your response. Thank you for your time.
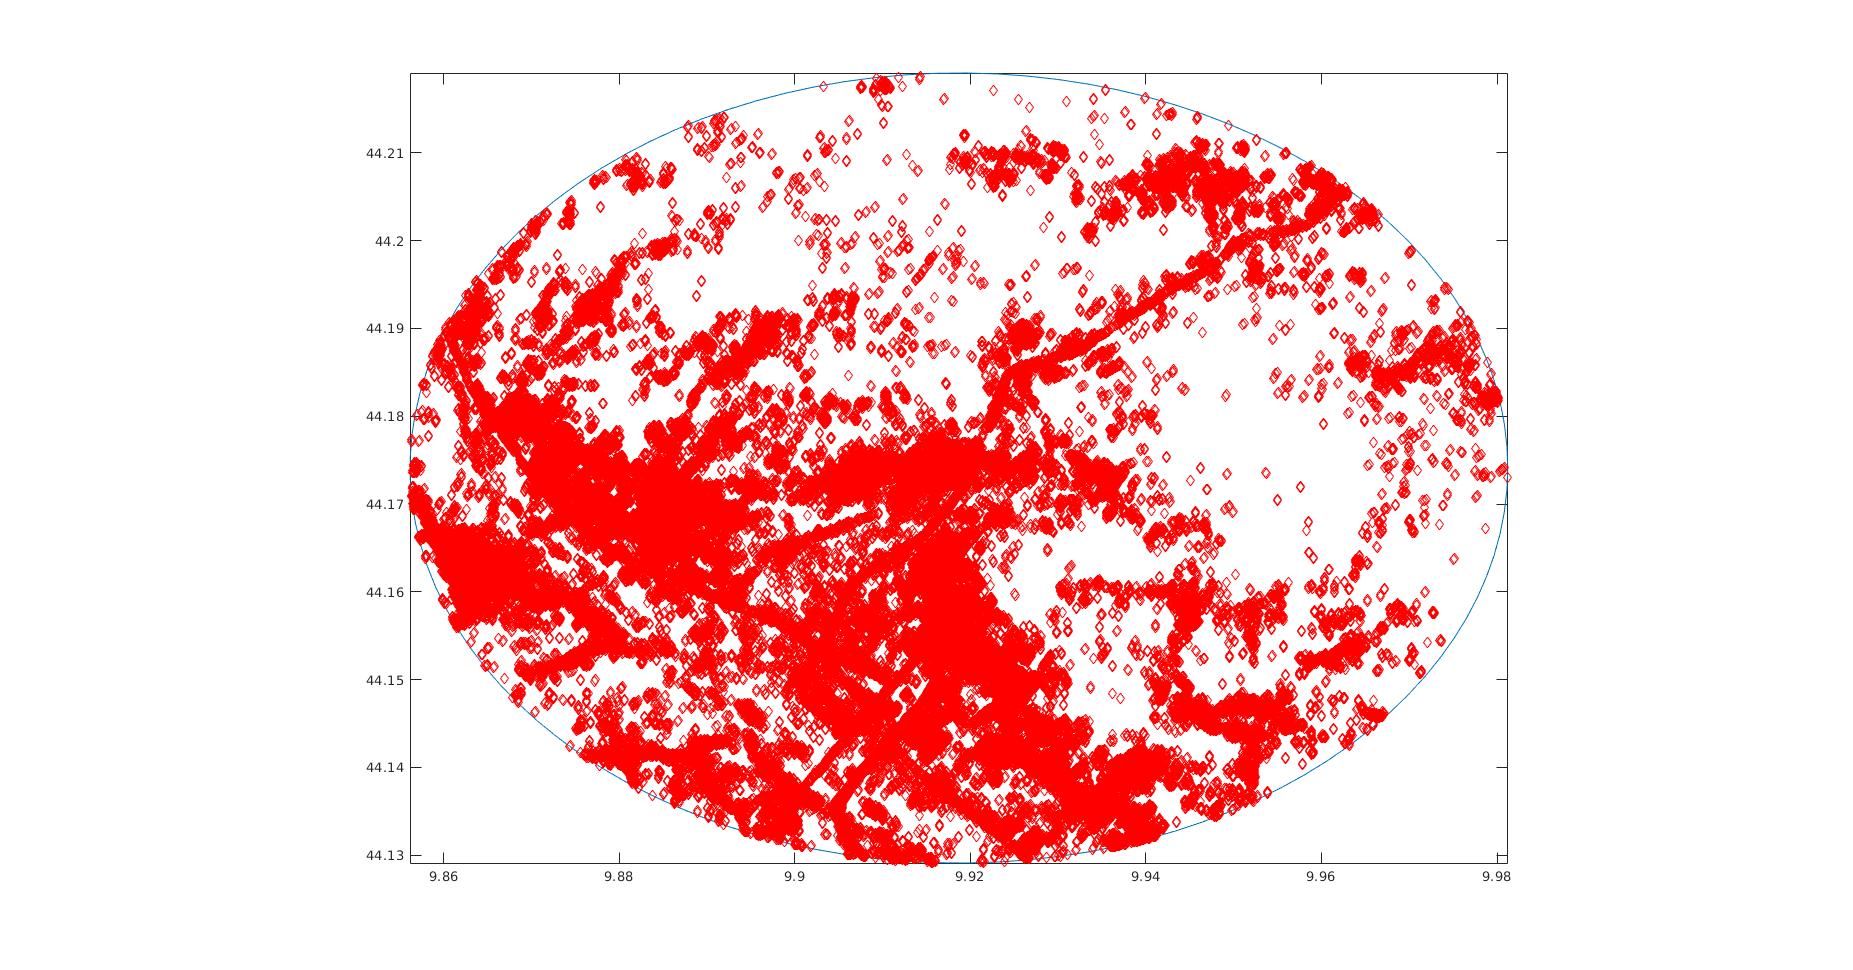
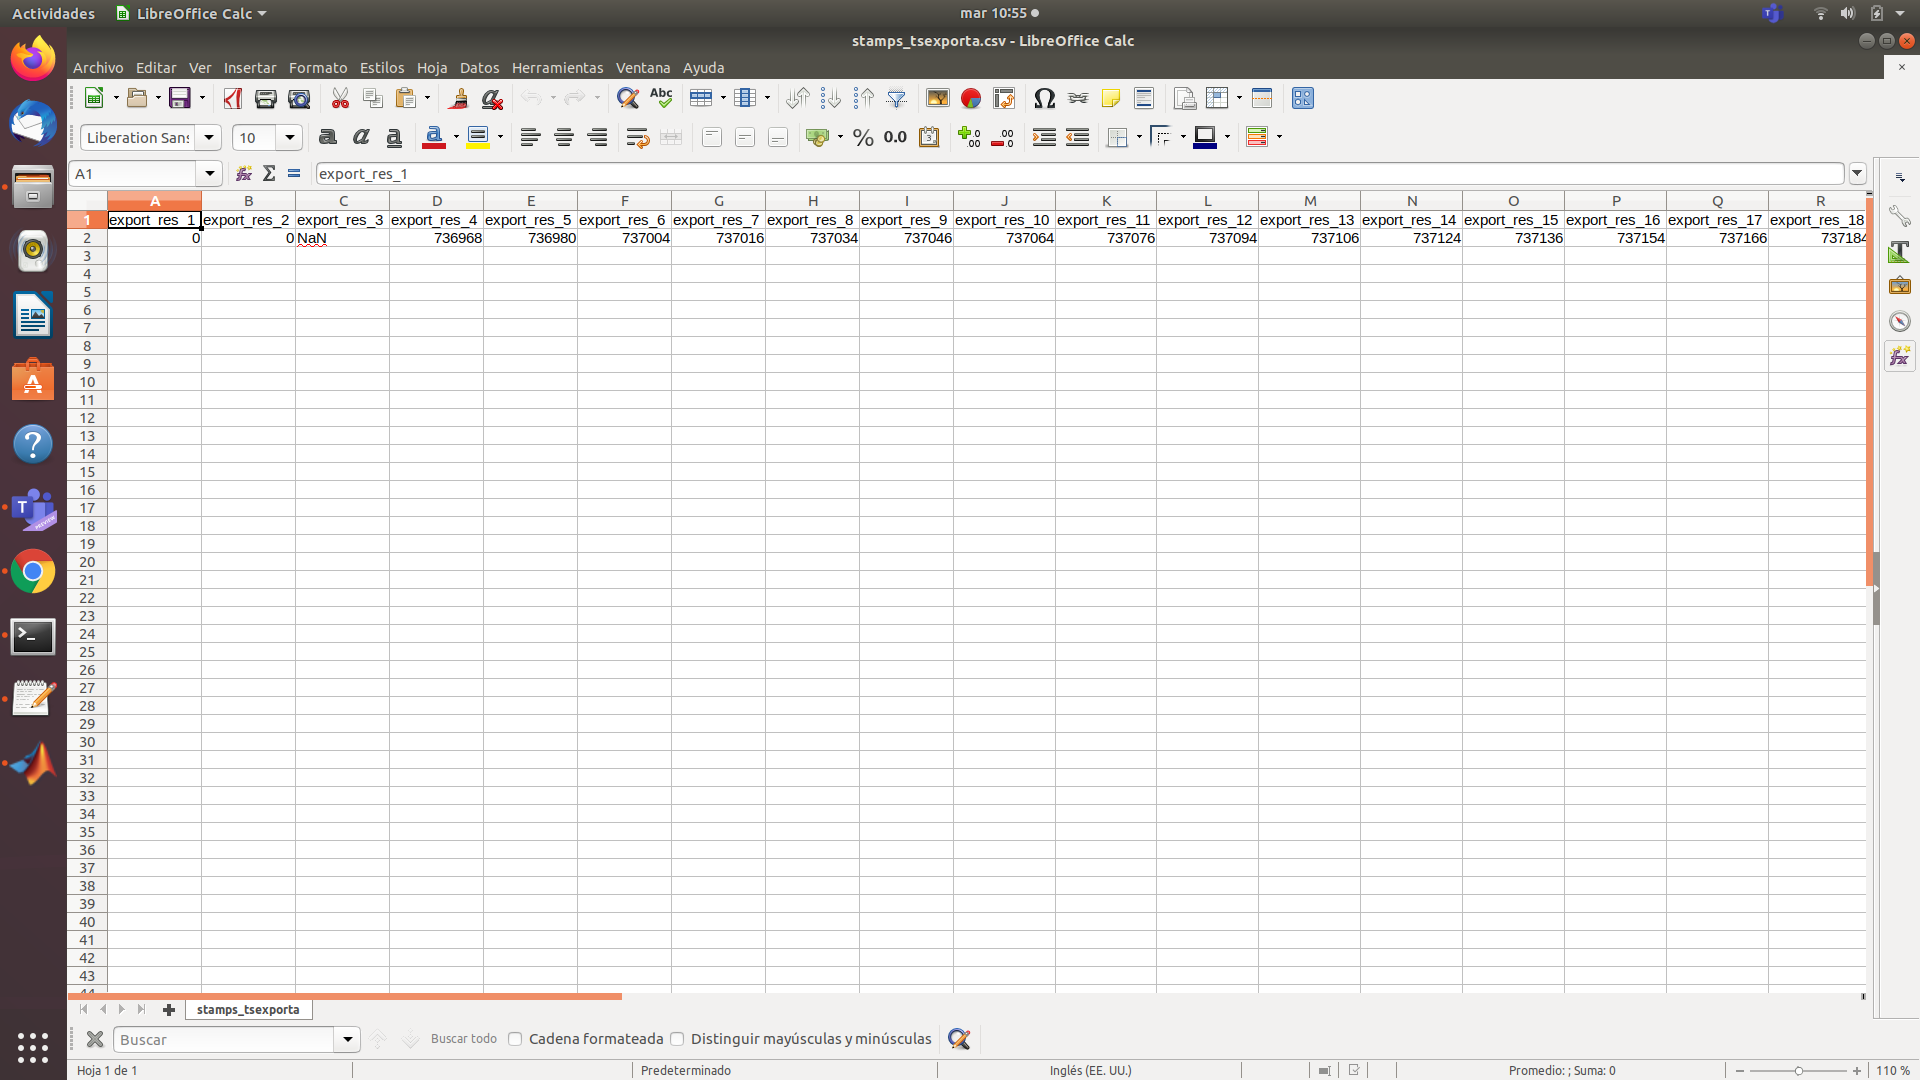
Hello, I did the analysis of my study area in Stamps with 3 patch, I had no problem until exporting it to a csv file.
As you can see in the images, I am able to generate the selection of my reference point.
However, the csv file that is generated does not contain information
What could be happening to me?
It’s a common problem, Try to cover all your area (radius value more means instead of 5000m provide 50km ).
THNX that works for me!
This is for SNAP or gamma software.
I think the software has evolved since this post (2017) and don’t think it’s necessary any longer to change the processor to ‘gamma’. I used ‘snap’ all times (was already set by mt_prep_snap) and it worked out fine.