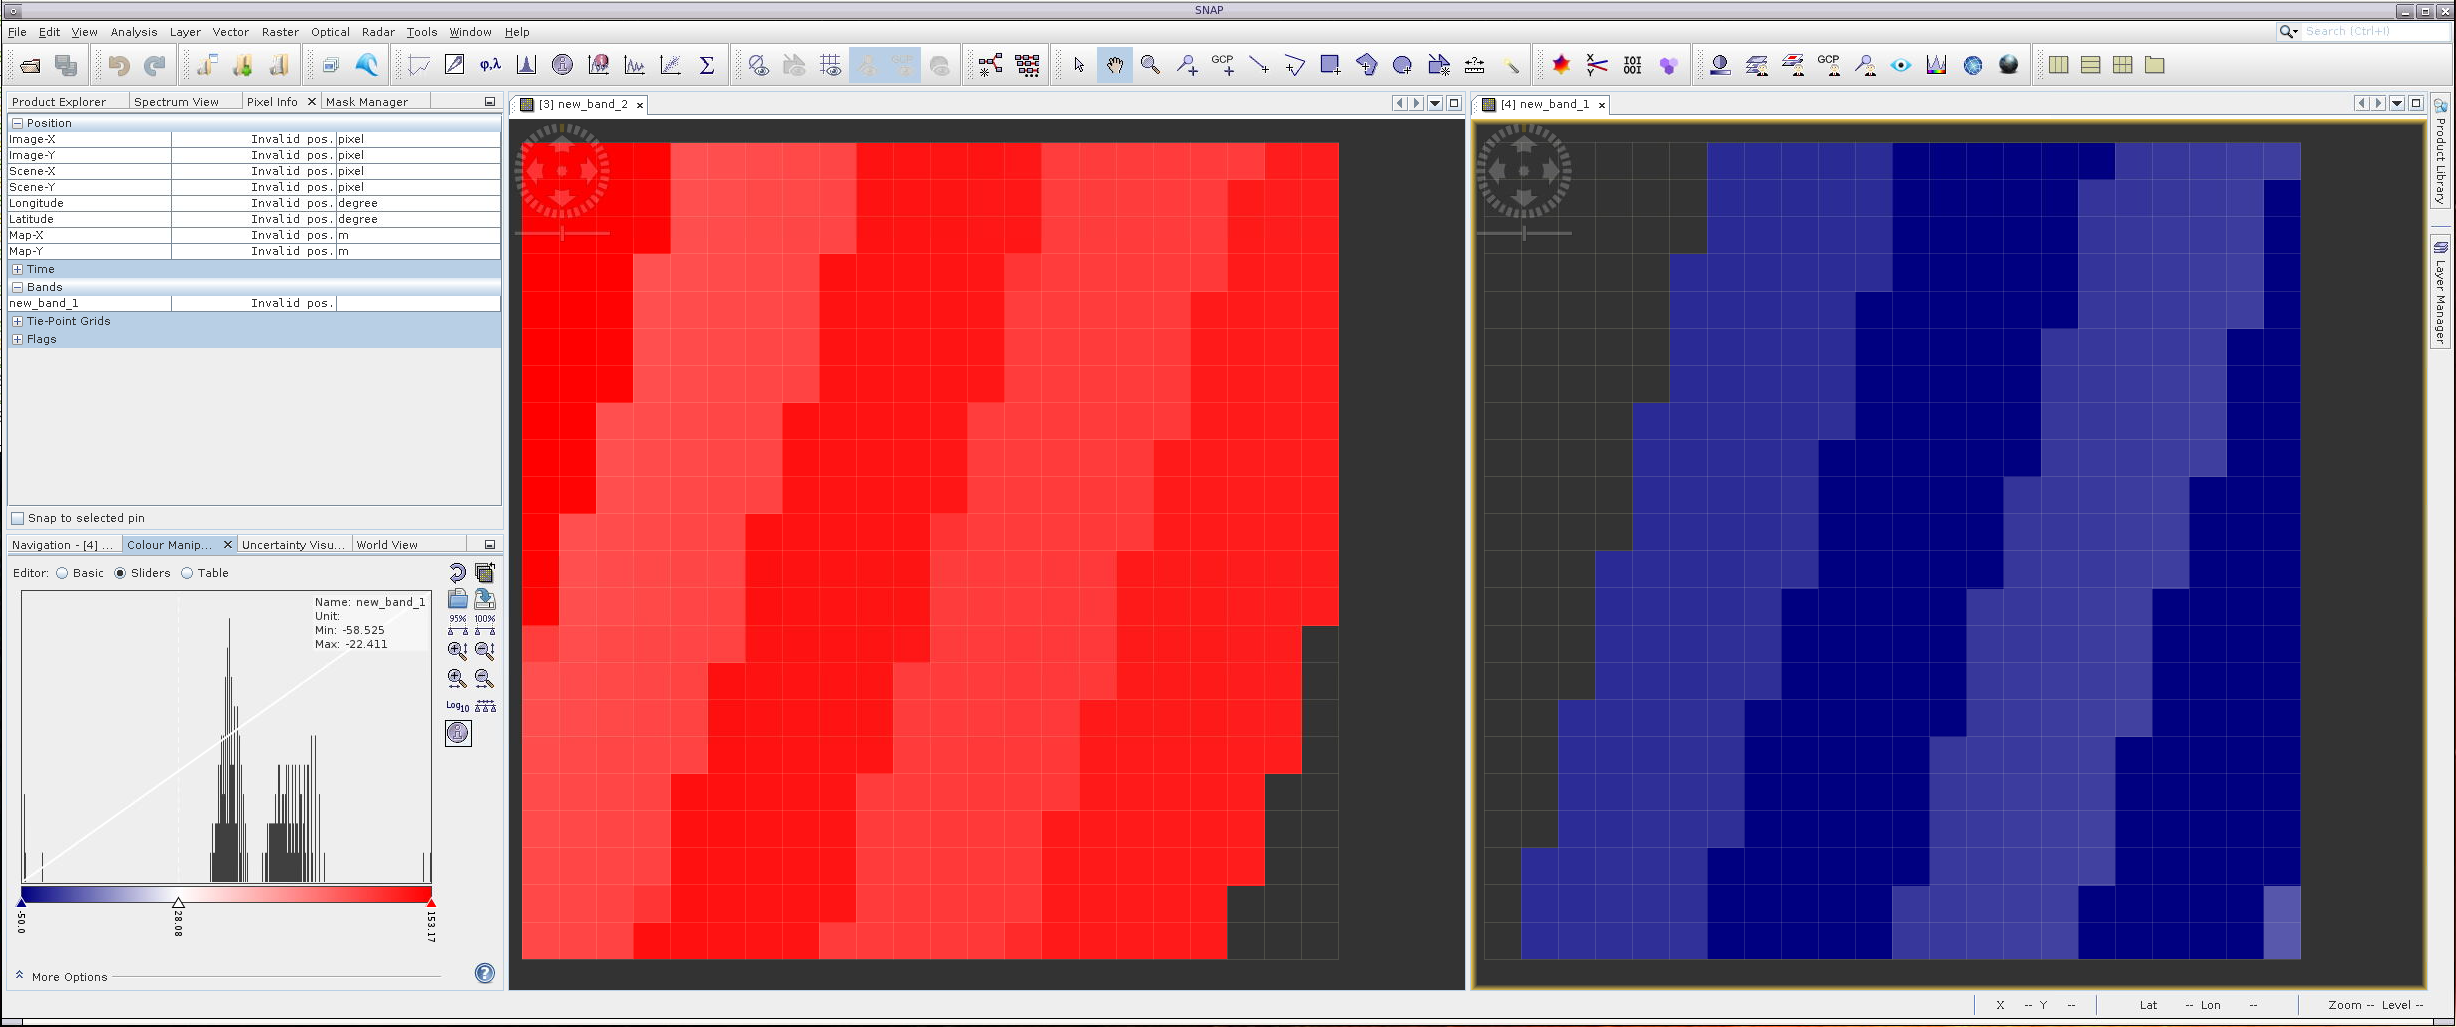
(For the screenshots I have applied the same style in QGIS to both images)
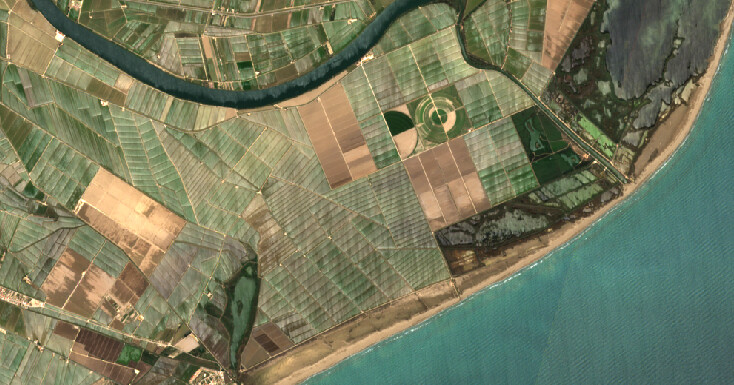
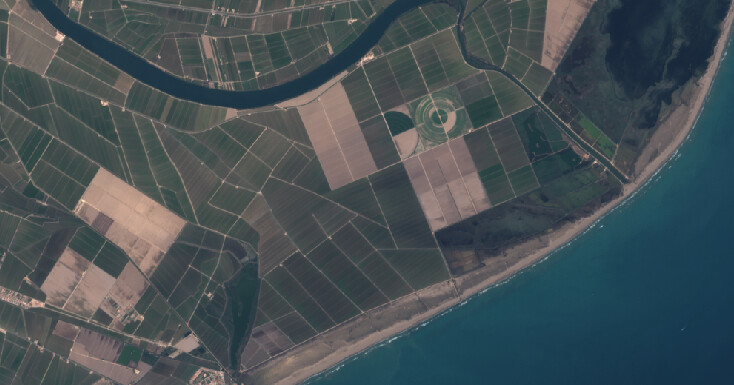
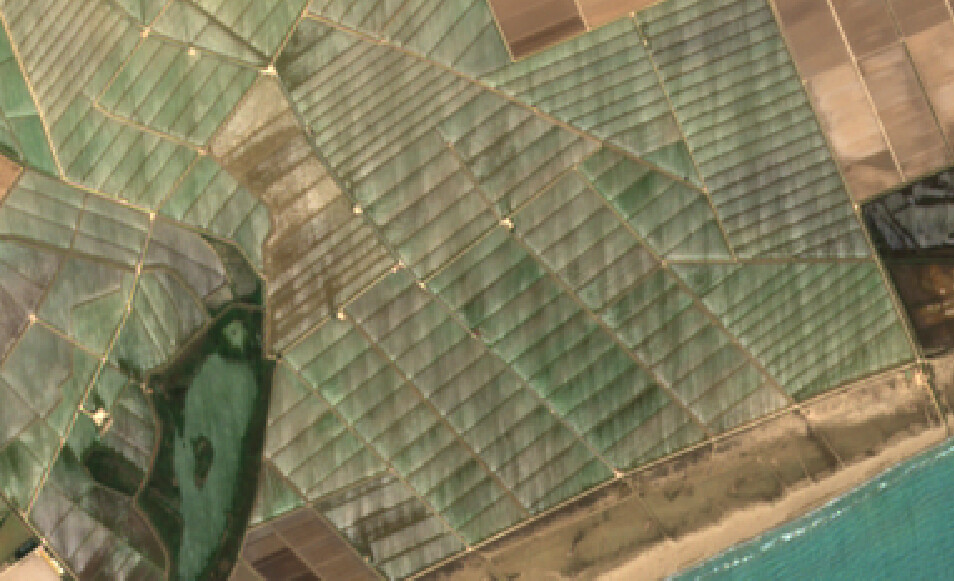
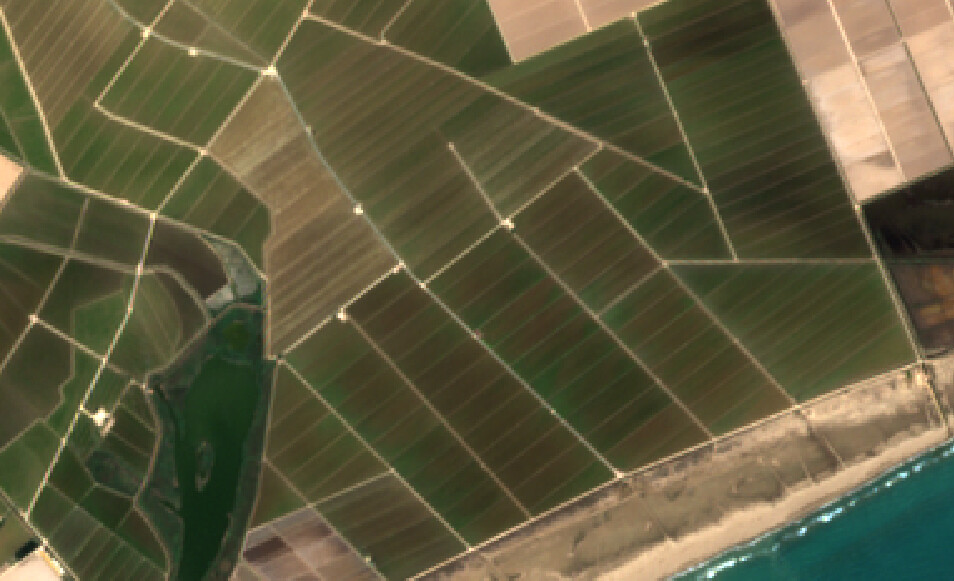
There is such a big variation between both images with just 2 days of difference. This affects to products like NDVI. Both images were taken at the same hour. Why is this happening? Is there a way to fix it?
Is you did this in QGIS this is not SNAP or S2TBX related.
In such cases it is better to contact the data provider. If this is Open Access Hub (copernicus.eu) then you can mail to eosupport@copernicus.esa.int.
In my experience the L2A is always gives a brighter scene on the ground.
L2A is computed surface reflectance
rather than L1C’s top-of atmosphere radiance.
It should also be noted that one image is S2A, and one S2B. Although that will provide less of a change than the L1C vs L2A component identified by @gbrelstaff
It should also be noted that both the radiometry of S2A and S2B acquisitions is routinely monitored by expertise, and both S2A and S2B are within the specifications set down in the Mission Requirements. The radiometric (and geometric) status of the L1C from both S2A and S2B is provided to users via the L1C Data Quality Report and L2A Data Quality Report.
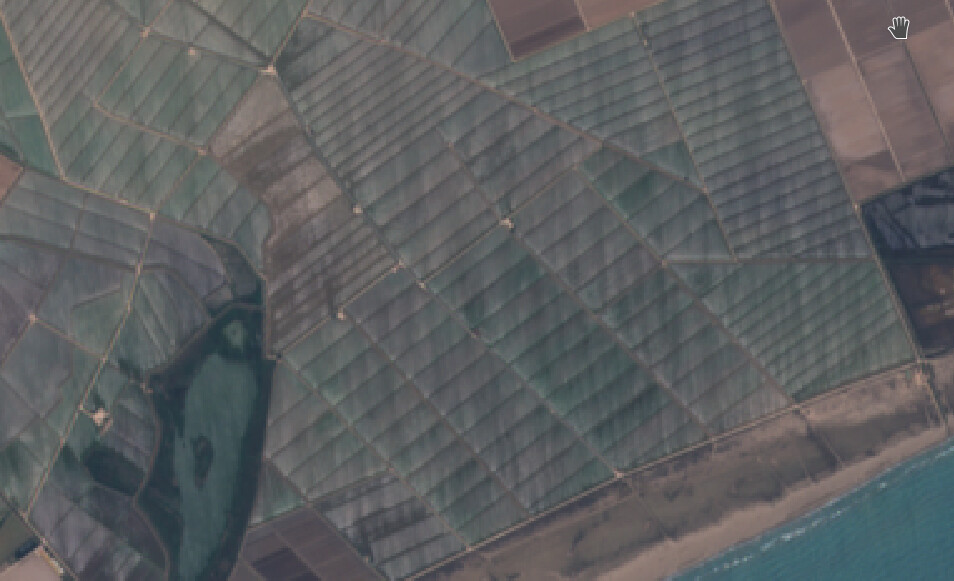
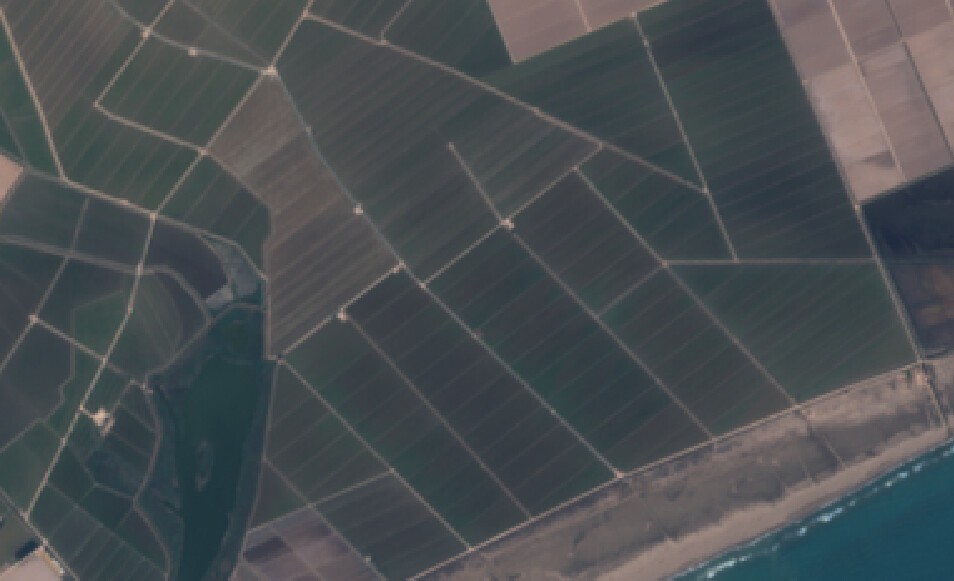
If I compare the 1st vs 2nd photo and the 3rd vs 4th photo they are too different for just a timelapse of 2 days even though as @Jan commented one is S2A and the other S2B.
Anyways I’m going to have a look at the links that you shared and if I don’t find the problem I’ll send an email to eosupport@copernicus.esa.int.
This seems to be due to a temporary change in the Scene Classification on 5 of May at Illa de Buda.
If you look at the time sequence of the Scene Classification Map online here
and click the next date arrow - the blue (water) changes to Yellow and grey
click again and it goes back to the usual blue.
My guess is the artificial irrigation system on the ground broke down before 12:00 on 05 May 2021 - so the usual blue classification is lost and the usual L2A rendering got radically disturbed,
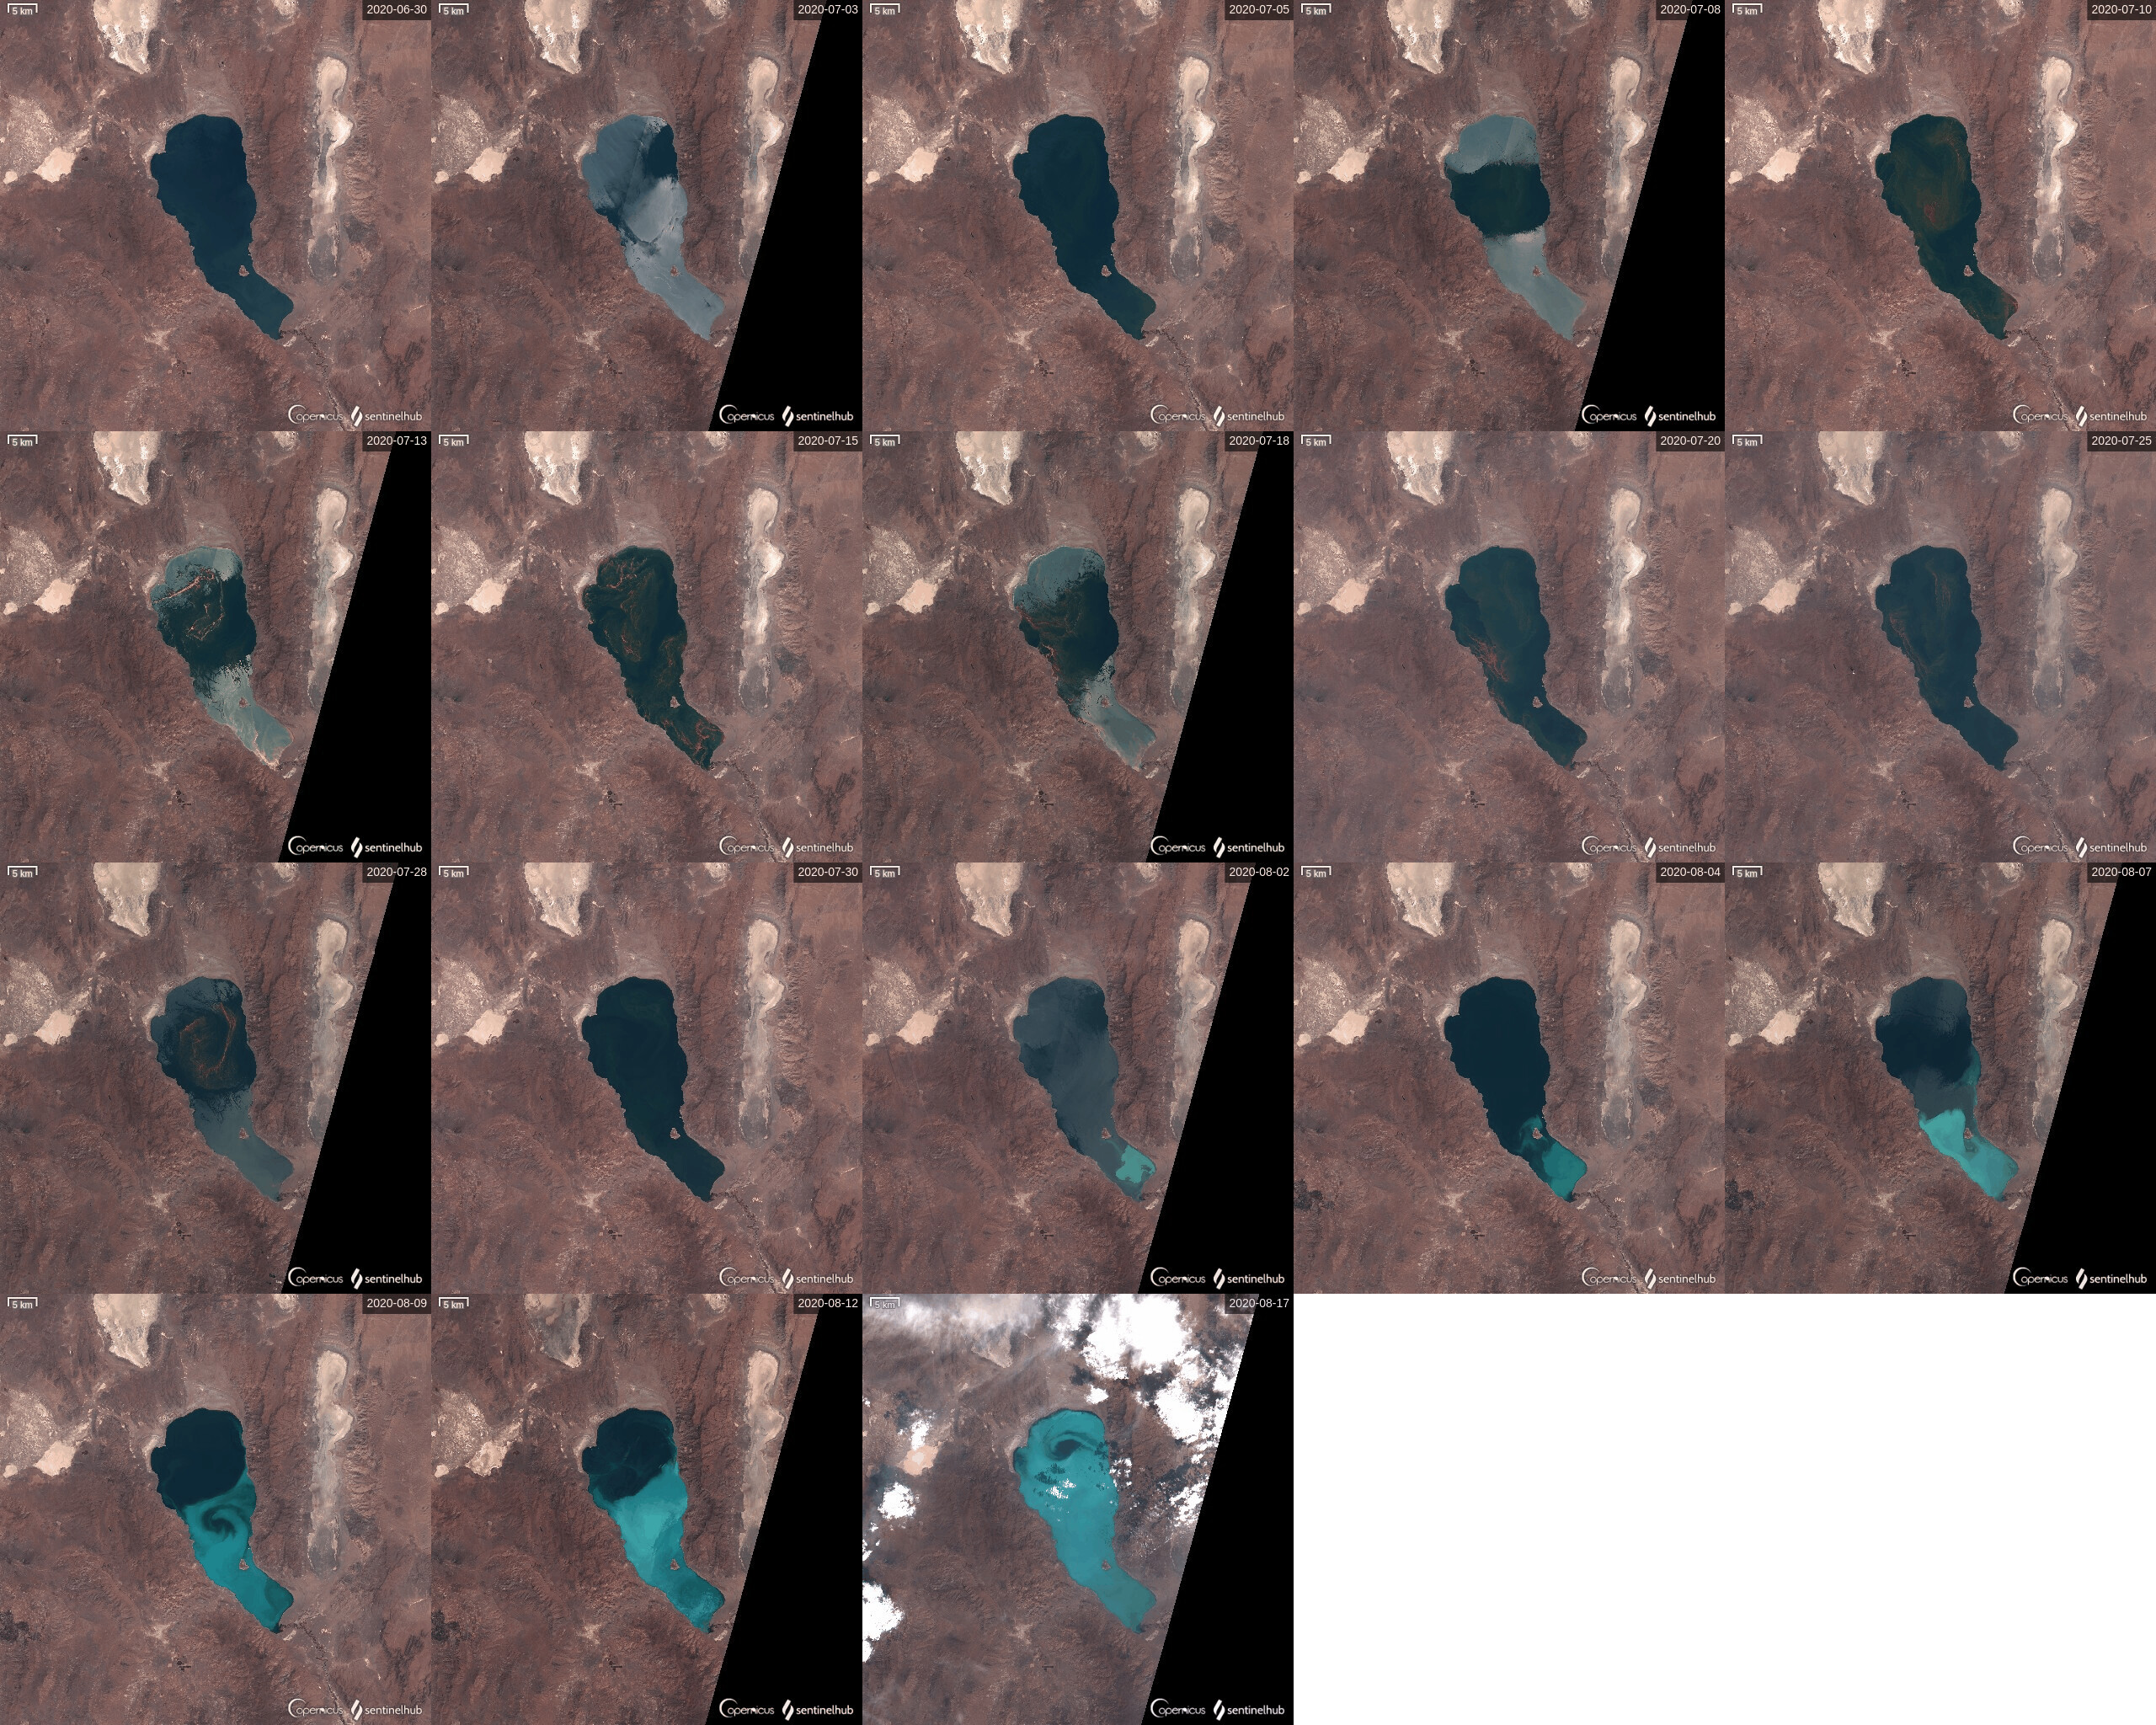
This type of observed differences seems to be due to sunglint in certain images (Sun reflection on rough water surface or with some Fresnel reflection compound).
The sunglint is highly directional (and very sensitive to surface roughness linked to surface winds): so you might have very different sunglint amount in your image between S2A and S2B where the azimuth angles can be different over your scene (is it a kind of rice field?).
I provide here a small example for a lake (which also undergoes a whiting effect)!
If you are just checking possible causes, it would also be interesting to see if there was a precipitation event between both days. In the first image the soil looks drier than in the second one. Artificial irrigation could also be tested. But in my opinion, it looks that your second image has a higher load of aerosols in the atmosphere and the AC is not working perfectly (or in the first one there is an overcorrection).
Actually, you will have to check the relative azimuth:
view_azi - sun_azi
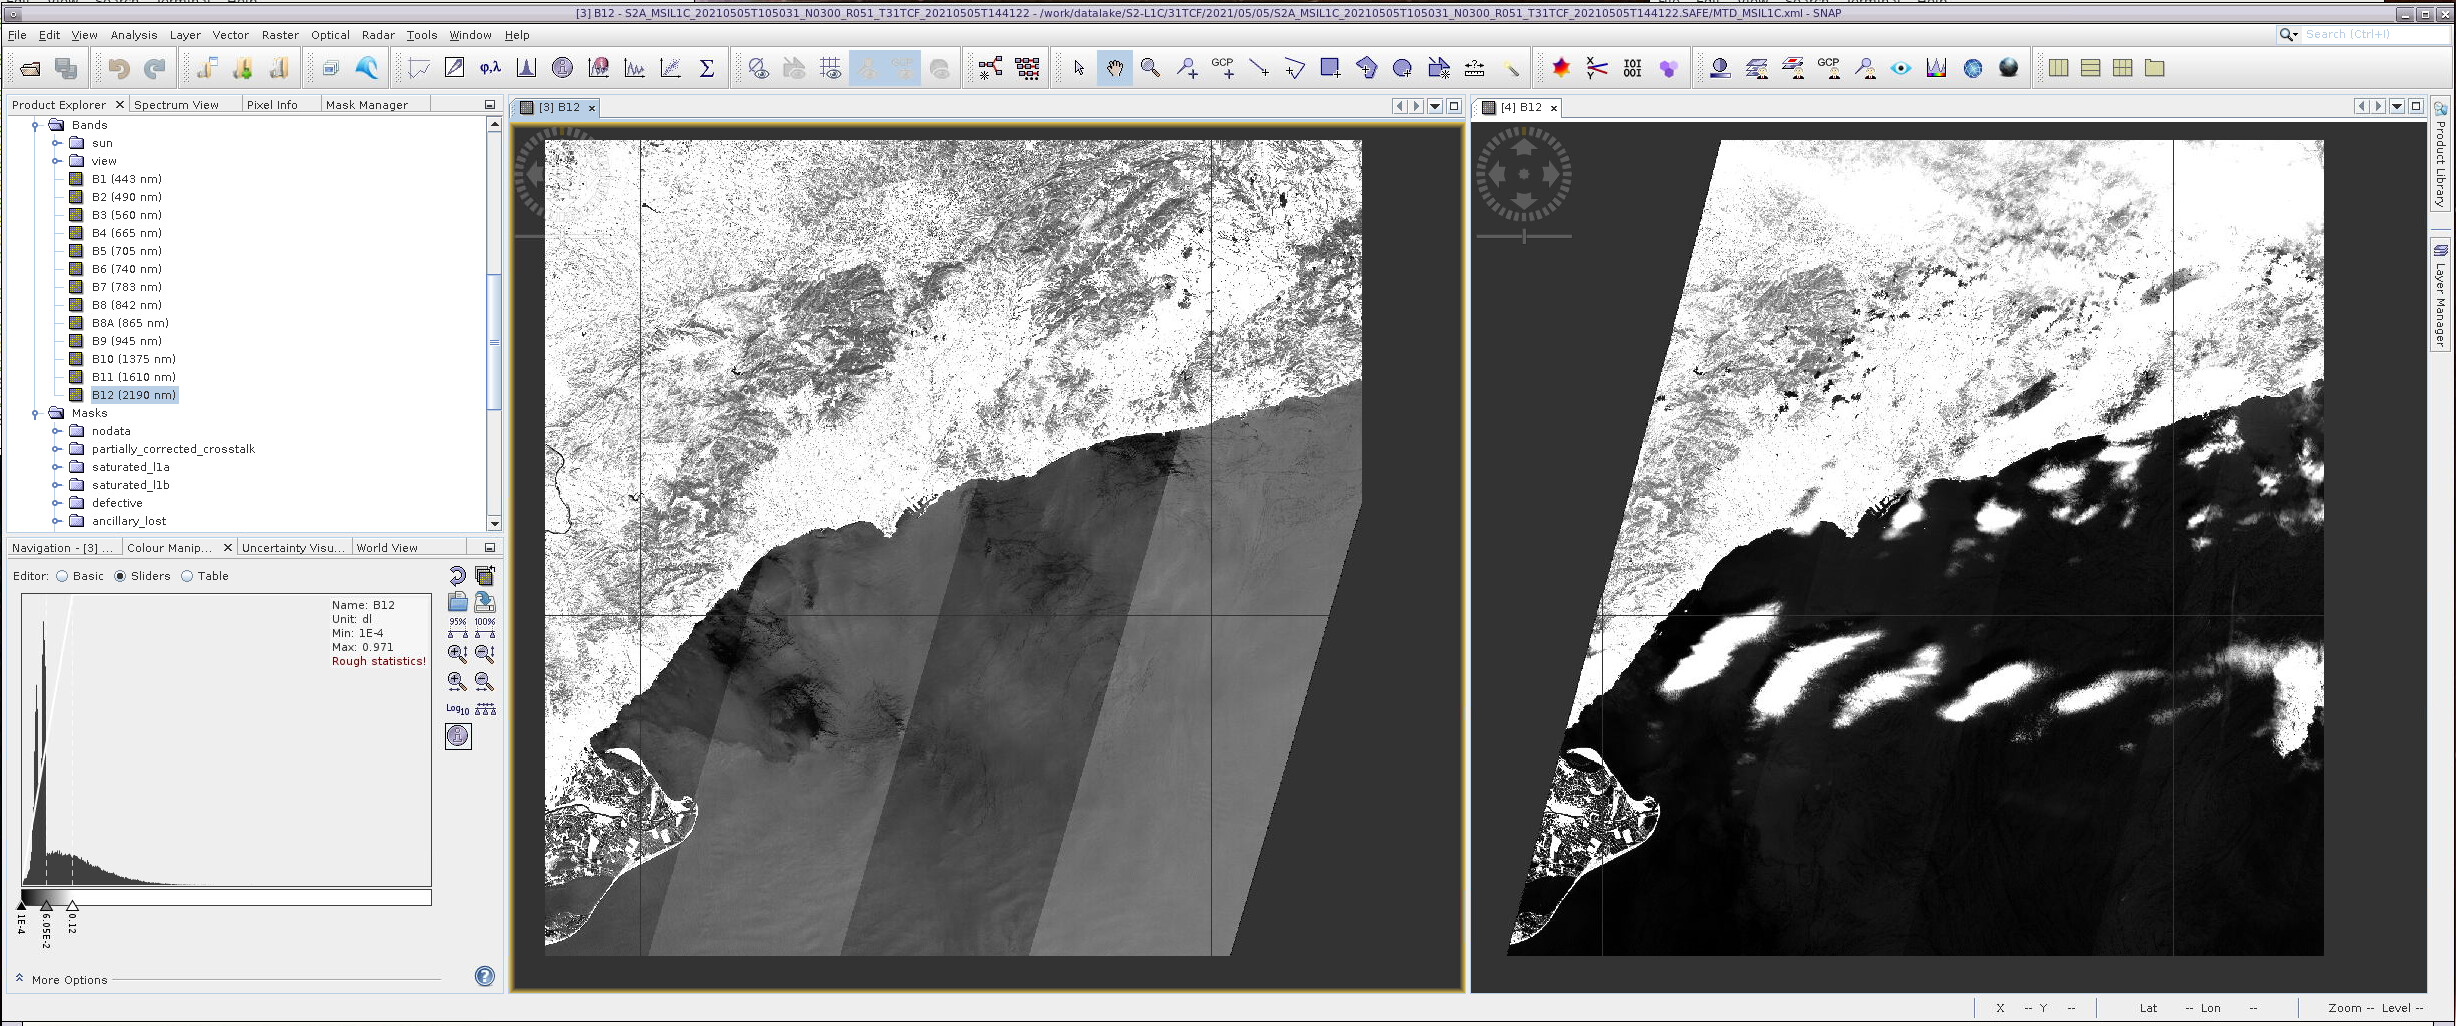
For your example, check RGB image, you can see that for tyhe “sunglinted” image (left) it is the right edge of the swath, and conversely for the other image on the right it is the left edge (sorry for the left/right ambiguities…):
Then you can check the sunglint signal over water with the SWIR bands -water totally absorbing, so your signal comes from surface reflection). This clearly shows that one image is impacted and not the other:
