Hello Dear Helpers,
If you can help me about this problem, ı would be so glad.
I have a problem about having the same results on both Google kml and matlab volocity results after StaMPS 4-1b processing
ı made my pre-processing in snap with this way (Top split - apply orbit file - back geocoding (ı choose SRTM 1 sec HGT auto download and cubic convolution method as resampling method and ı choose deramp and demod phase for making better coregistration)- deburst- spatial subset- interferogram formation (with subtracting topographic phase and flat-earth phase and with adding output elevation and orthorectified latitute and longitute) - and then ı got .deb and .deb.ifg files and ı exported these files to StaMPS- later ı got 4 files diff,rslc,geo,dem, like how ı should do. (I didn’t use snap2snap package, ı did all these pre-processing alone)
And then ı worked terminal while adding necessary paths (snaphu/bin, stamps-4-1b/bin, config.bash, triangle) and then ı worked StaMPS-4.1b with this code ; mt_prep_snap 20171022 /media/frat/C282BF7082BF6815/StaMPS-4.1-beta/ascending-20160107-20180719/INSAR_20171022 0.4 1 1 50 200 (just as how ı should do)
Later everything is oke and program worked with no problem BUT! later
when ı check some PS points ı realized that ı have some problems about having the same annual velocity results in Matlab and google kml file
For example; in matlab it shows, maximum and minimum annual velocities are between (-12.9, 6.3) in the colour scale on the right side, but in google kml file, ı can see some points which have -15 mm annual velocity which exceeds the minimum annual velocity limit in matlab. So which one is true ? ı think google-earth kml, right ? Also when ı compare google-earth results with StaMPS Visualizer results, these are similar but not exactly the same. So how can ı fix this problem ?
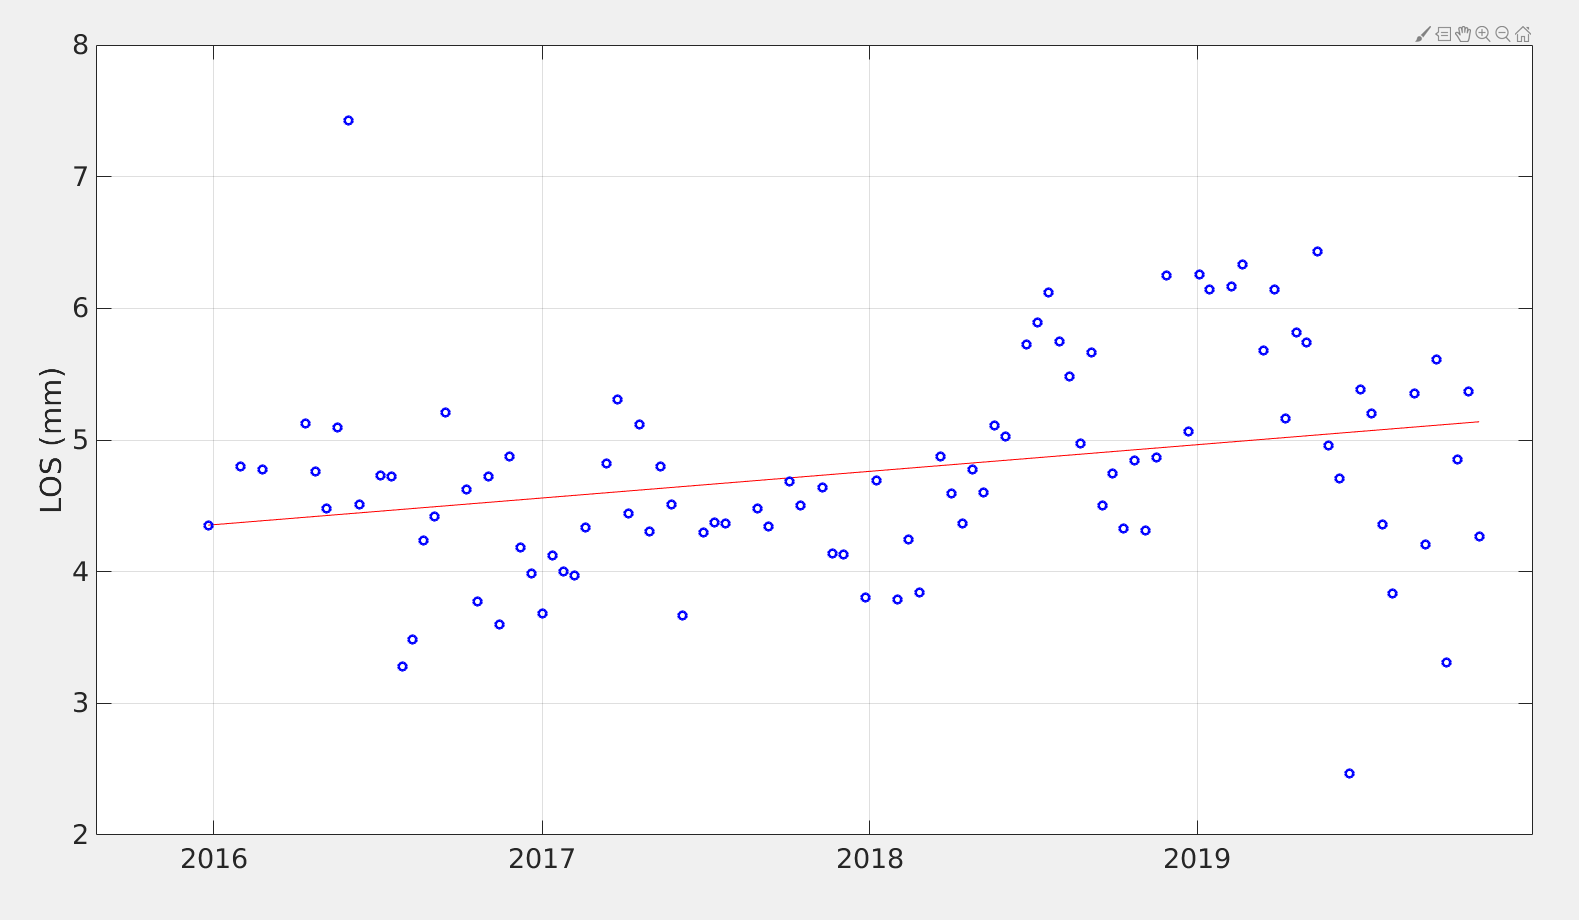
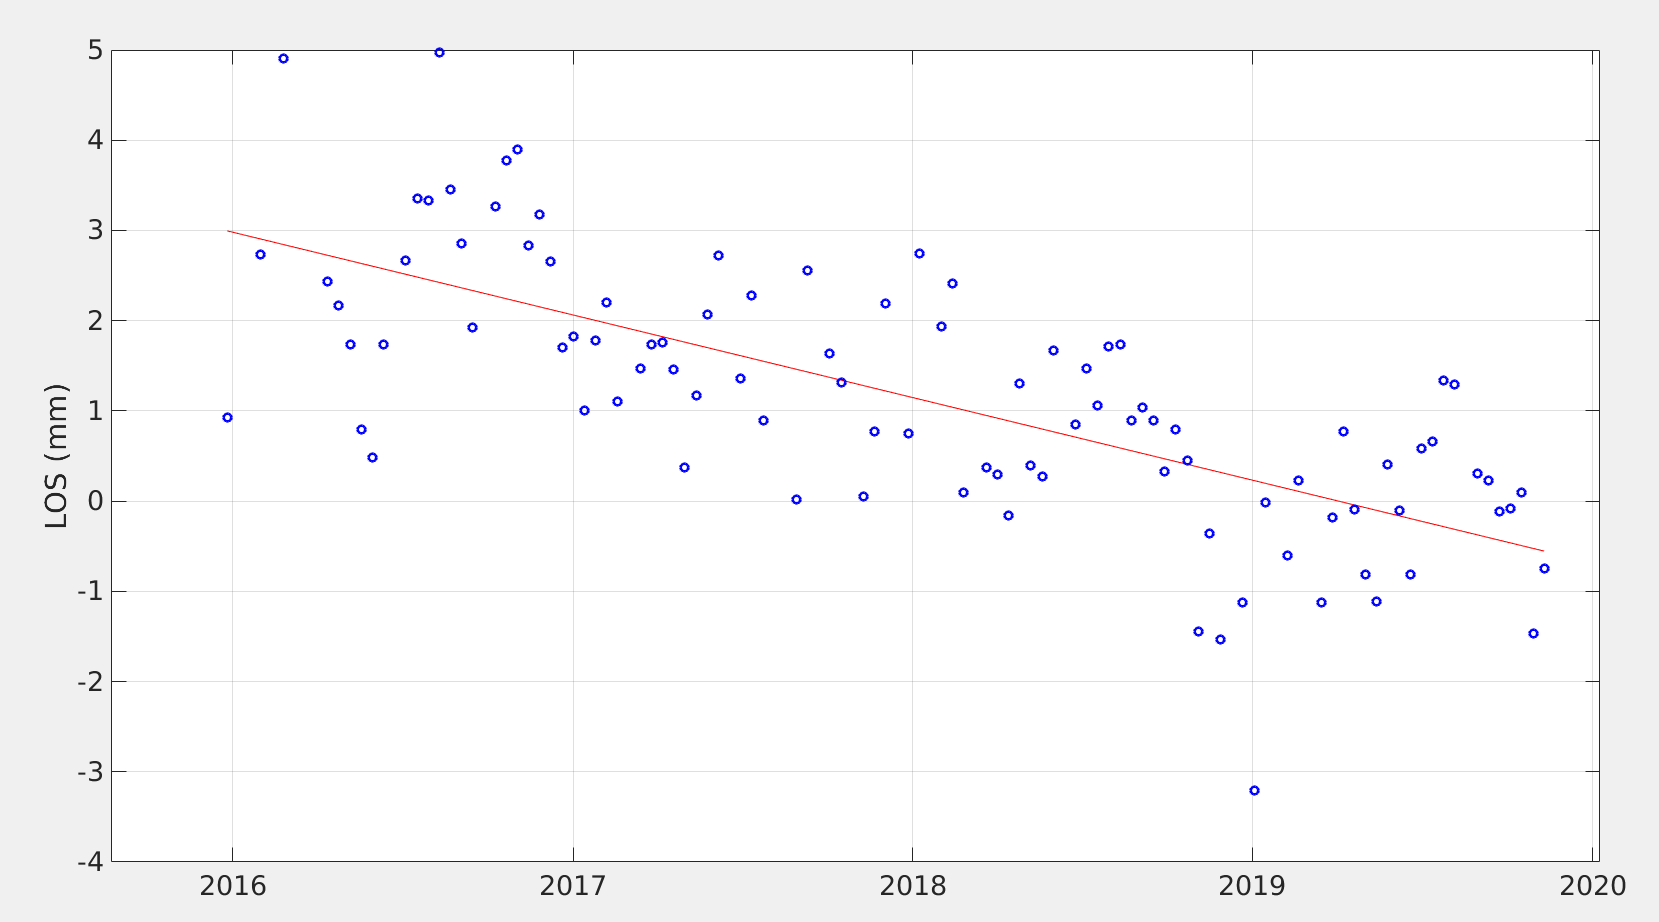
And also when ı plot velocities in matlab it shows dates wrong (my processing dates between 07.01.2016-19.07.2018 but it shows wrong like below
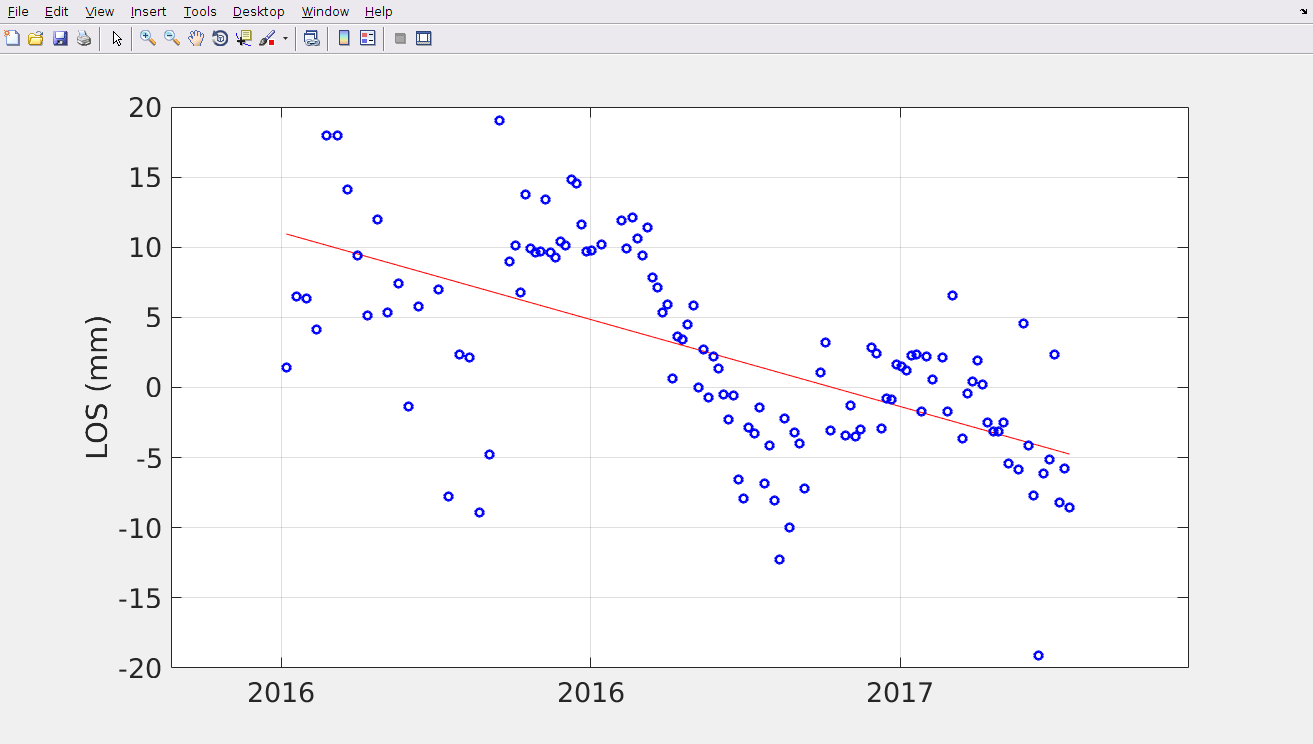
I think ı have some bug, for fixing this bug ı deleted stamps and installed it again. Before ı was using mt_prep_gamma script and ı thought that this can be because of this script but now ı installed stamps4.1b again and ı stoped to use mt_prep_gamma script but still ı have this problem.
Can you help me please ? thank you so much