I am interested in using LAI values (or LAI derived from NDVI) as inputs into a canopy model I am developing.
I have downloaded the LAI and NDVI products from the Copernicus data hub, and have also taken the original Sentinel 2 tile data and used the built in processors to generate LAi and NDVI values for my ROI.
When I try and compare the two in SNAP it seems that the ‘products’ (downloaded as custom .tif files) are at a completely different scale to the subset files I have generated and so I am unable to visually compare the two.
From reading the product manual for the LAI product it seems that only two land use categories are used, EBF and non EBF (Evergreen broadleaf forest) - as my ROI is in Wales (no EBF species present) am I to assume that the LAI value is invalid for my ROI?
Does the LAI processor within SNAP use a vegetation type classification, if so, how is it defined?
Does the NDVI processor use the same algorithm as the NGVI product (i.e using an average of the red and NIR bands) ?
I know there are a lot of questions here, but I would love some answers!
can you please show an example by screenshots?
Where exactly are the NDVI and LAI tif files from?
The custom NDVI and LAI files are from the Copernicus Global Land Service website here : https://land.copernicus.vgt.vito.be/PDF/portal/Application.html#Browse;Root=512260;Collection=1000062;Time=NORMAL,NORMAL,-1,-1,
downloaded from the link that they give me in the order complete email.
I can’t do screenshots at the moment as i’m running sen2cor on an image and it’s taking forever!!
I will update as soon as I can 
Could it be that the tif file is only a quicklook?
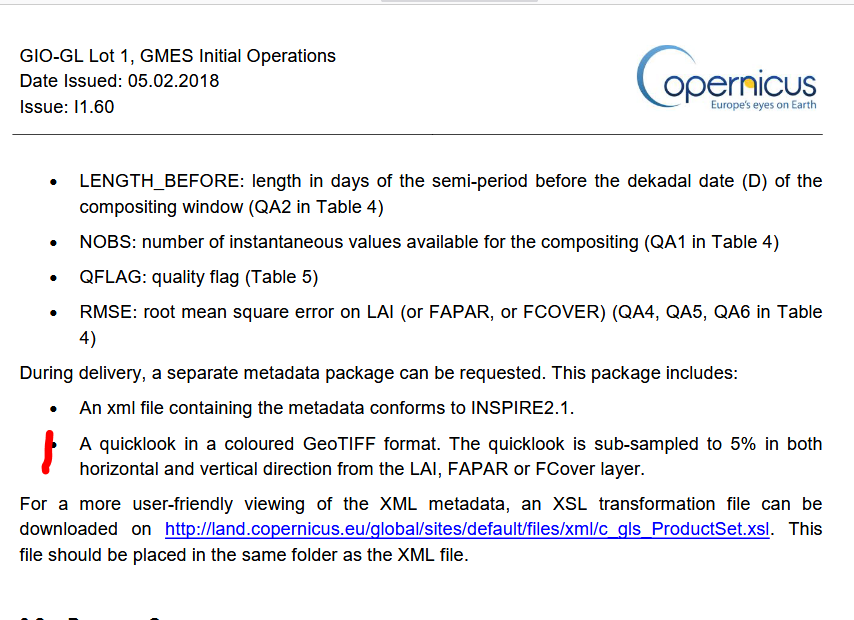
Besides that, the downloaded data has to be rescaled manually according to the documentation:
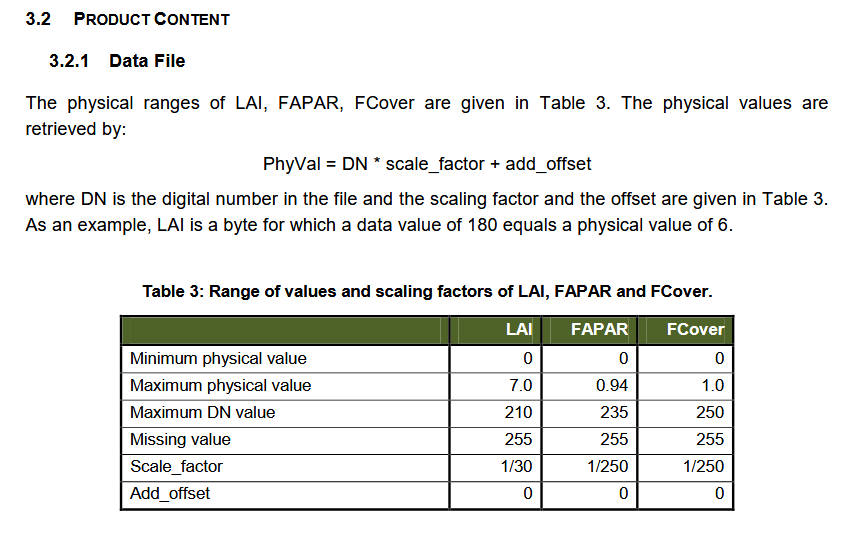
Source: https://land.copernicus.eu/global/sites/cgls.vito.be/files/products/GIOGL1_PUM_LAI300m-V1_I1.60.pdf
Similar for the NDVI: https://land.copernicus.eu/global/products/ndvi
If I specify geotiff as the format on the download request page do I only get the quicklook?
Do I need to specify NetCDF4 format to get the full dataset?
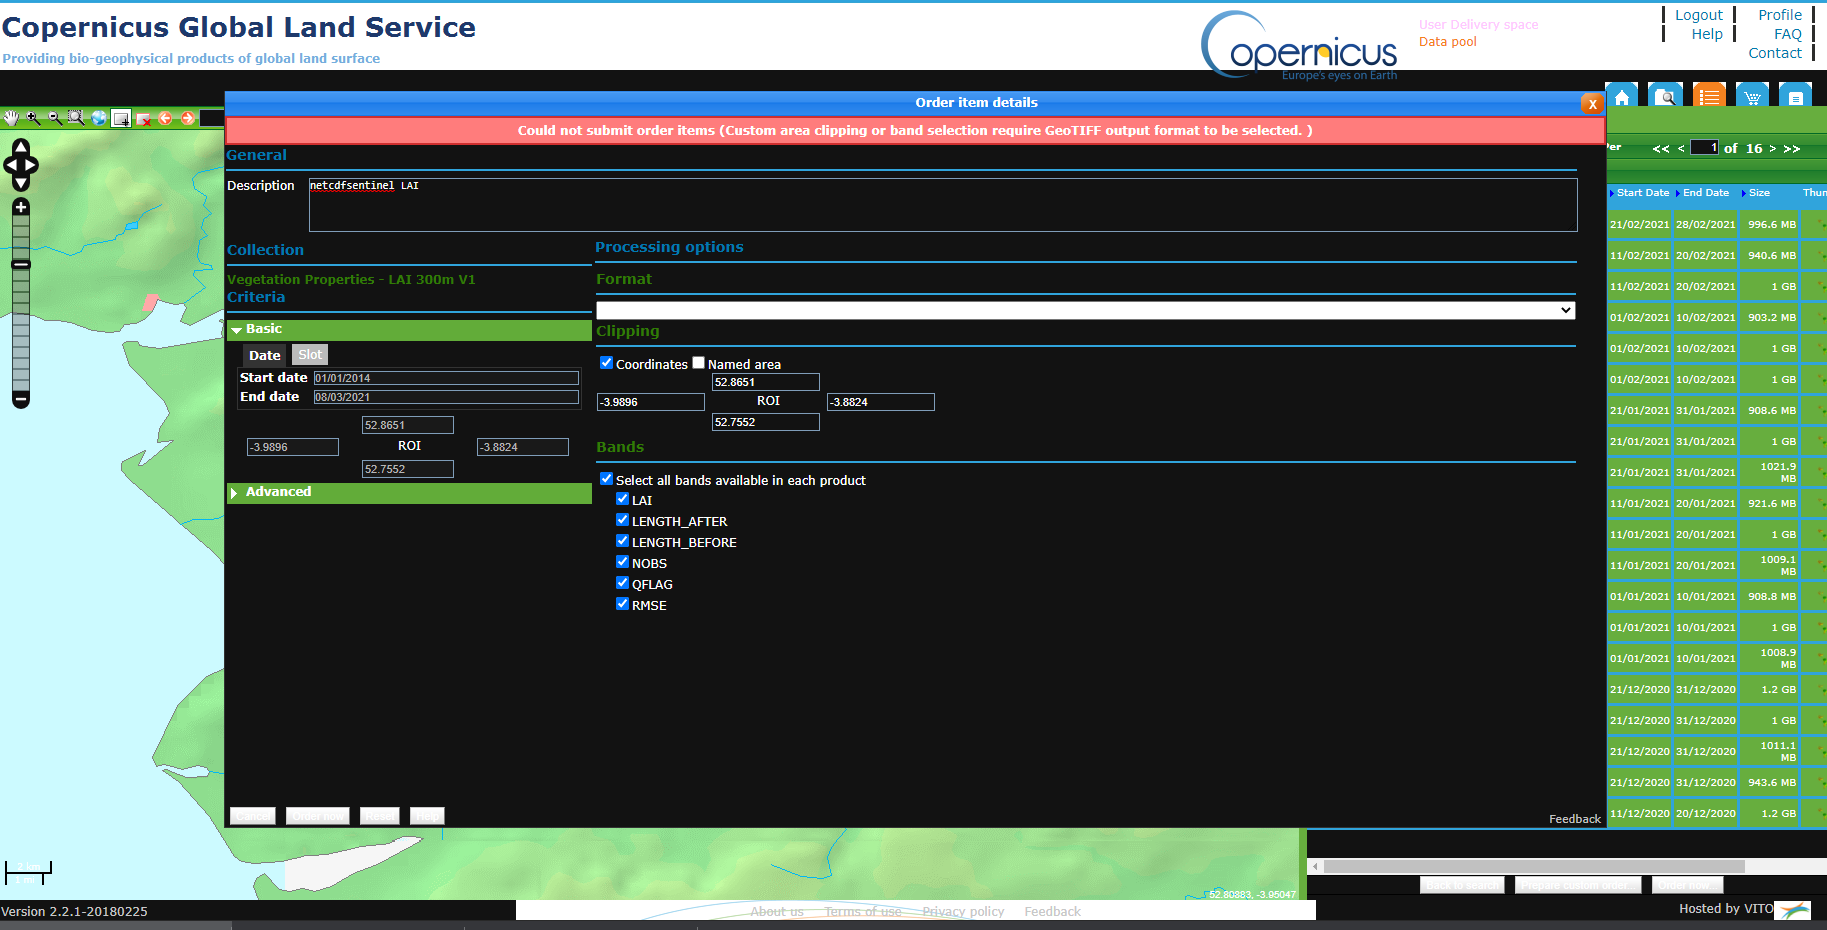
OK, answered my own question, If i select a ROI, it seems i can oly request GEOTIFF format:
and when i open one of these .tiff files in SNAP, as well as my subset [1]
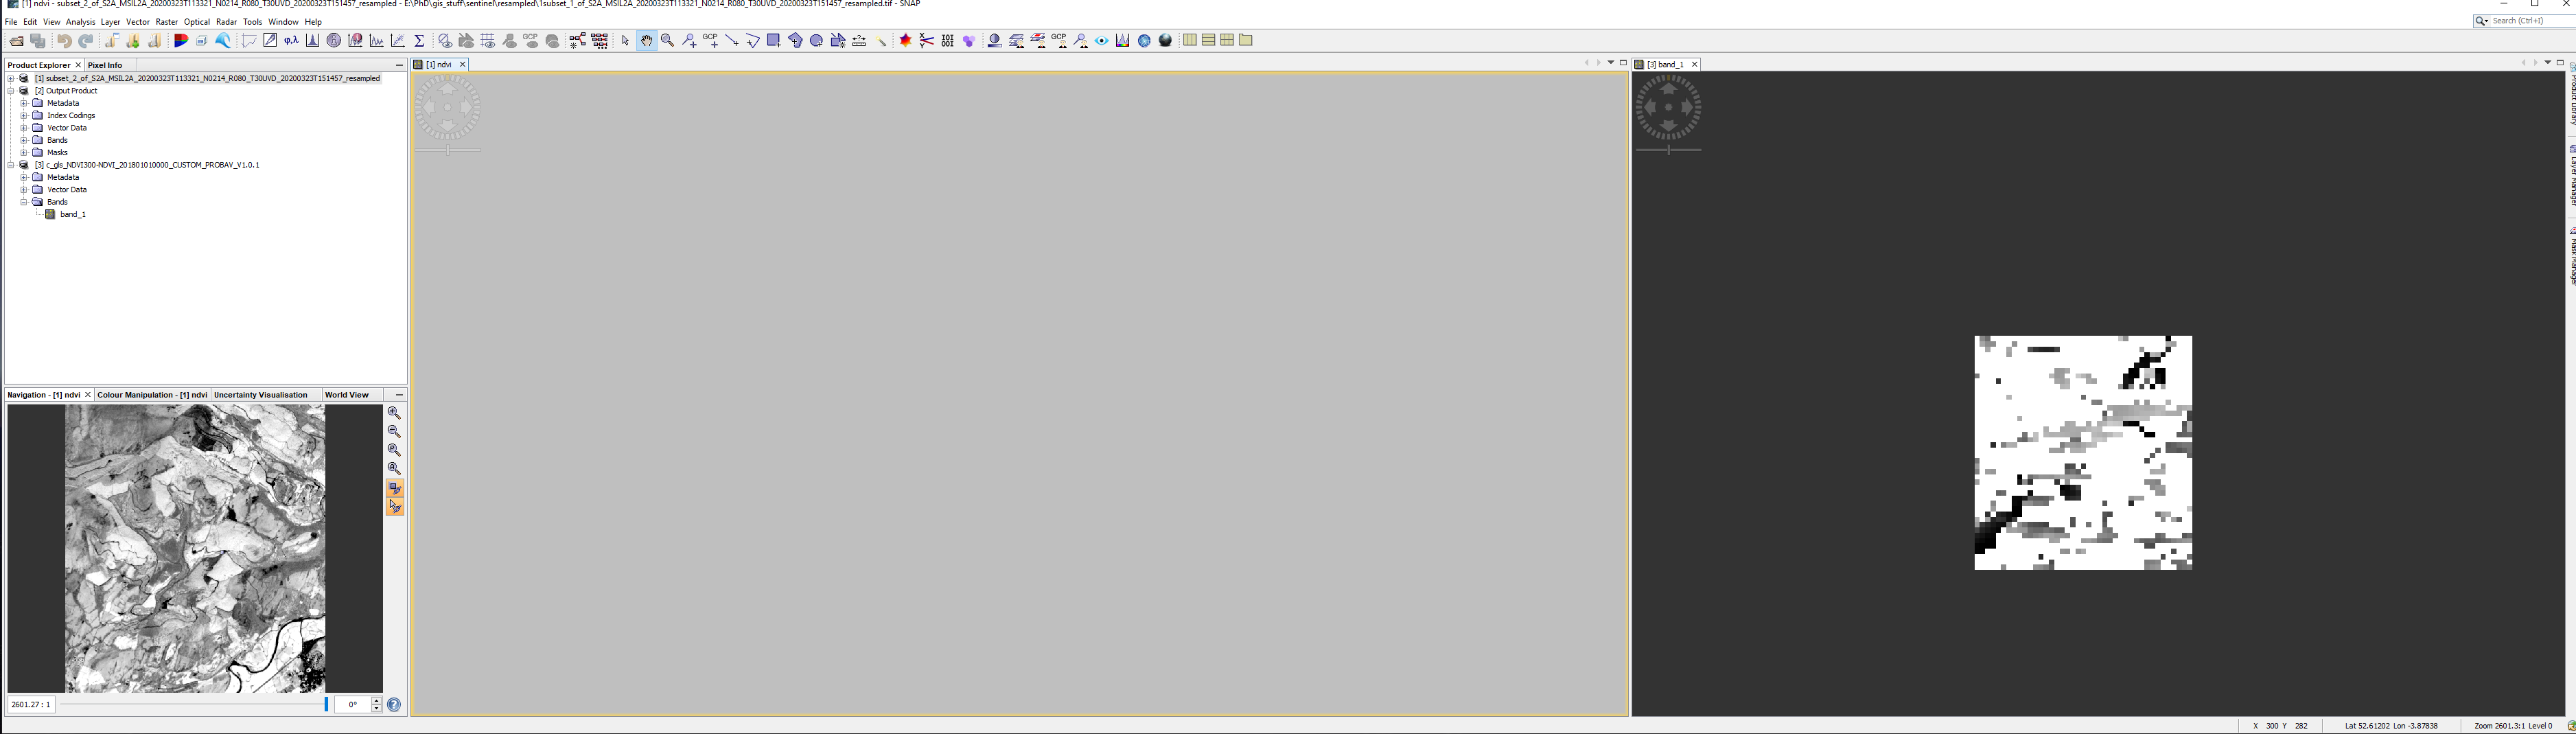
these two images are supposed to be thye same geographical area!
as I understood it, the actual data is in NetCDF format, but I have never used the subset request.
Can you please select band_1 and open the info tool? ![]()
it contains information on the dimensions, the data type ect…
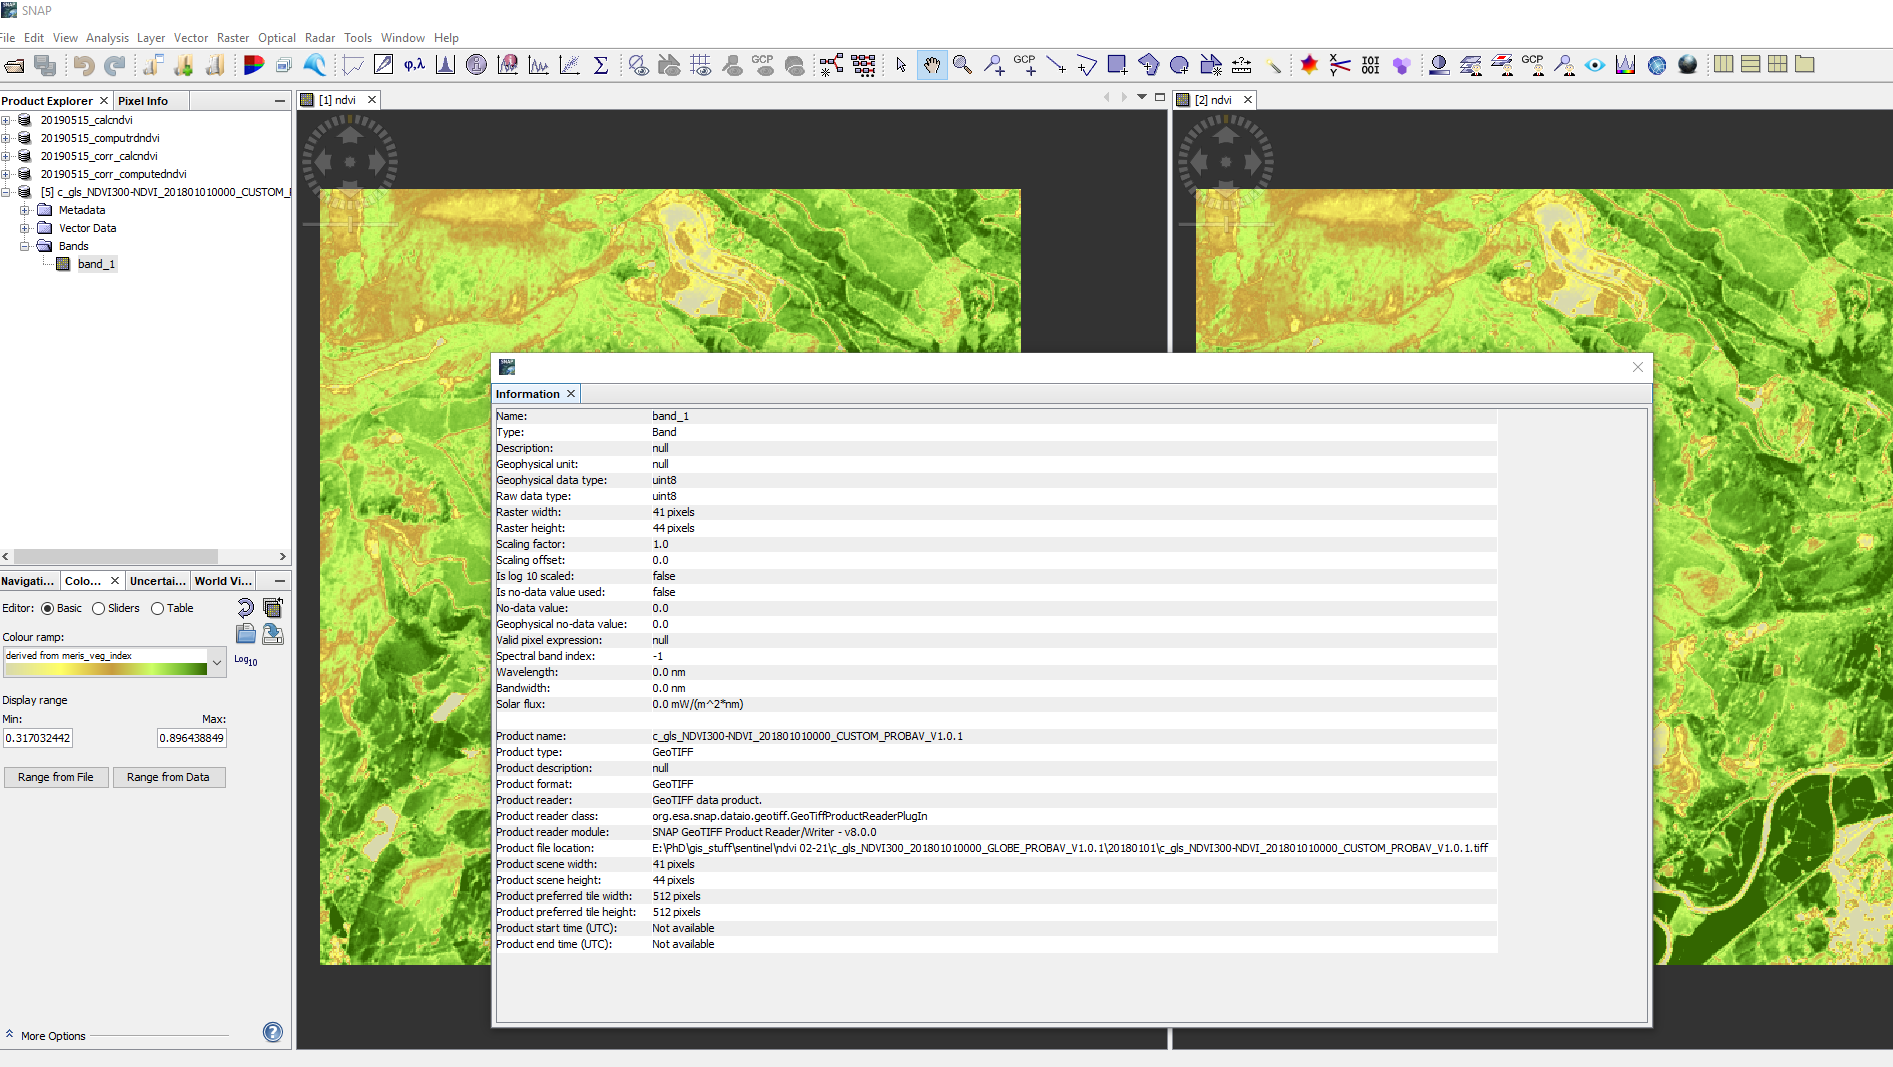
8 bit unsigned integer does not look like a real product to me. I’d say this is the quicklook and you need the NetCDF file instead.
Any idea how i would get the netcdf file for my ROI? the website says : Could not submit order items (Custom area clipping or band selection require GeoTIFF output format to be selected.
I’m not very familiar with this page, sorry.
Do you know anyone who is? I’ve tried the help pages on the website, but the vidoes are 6 years old and relate to a previous version of the browser!
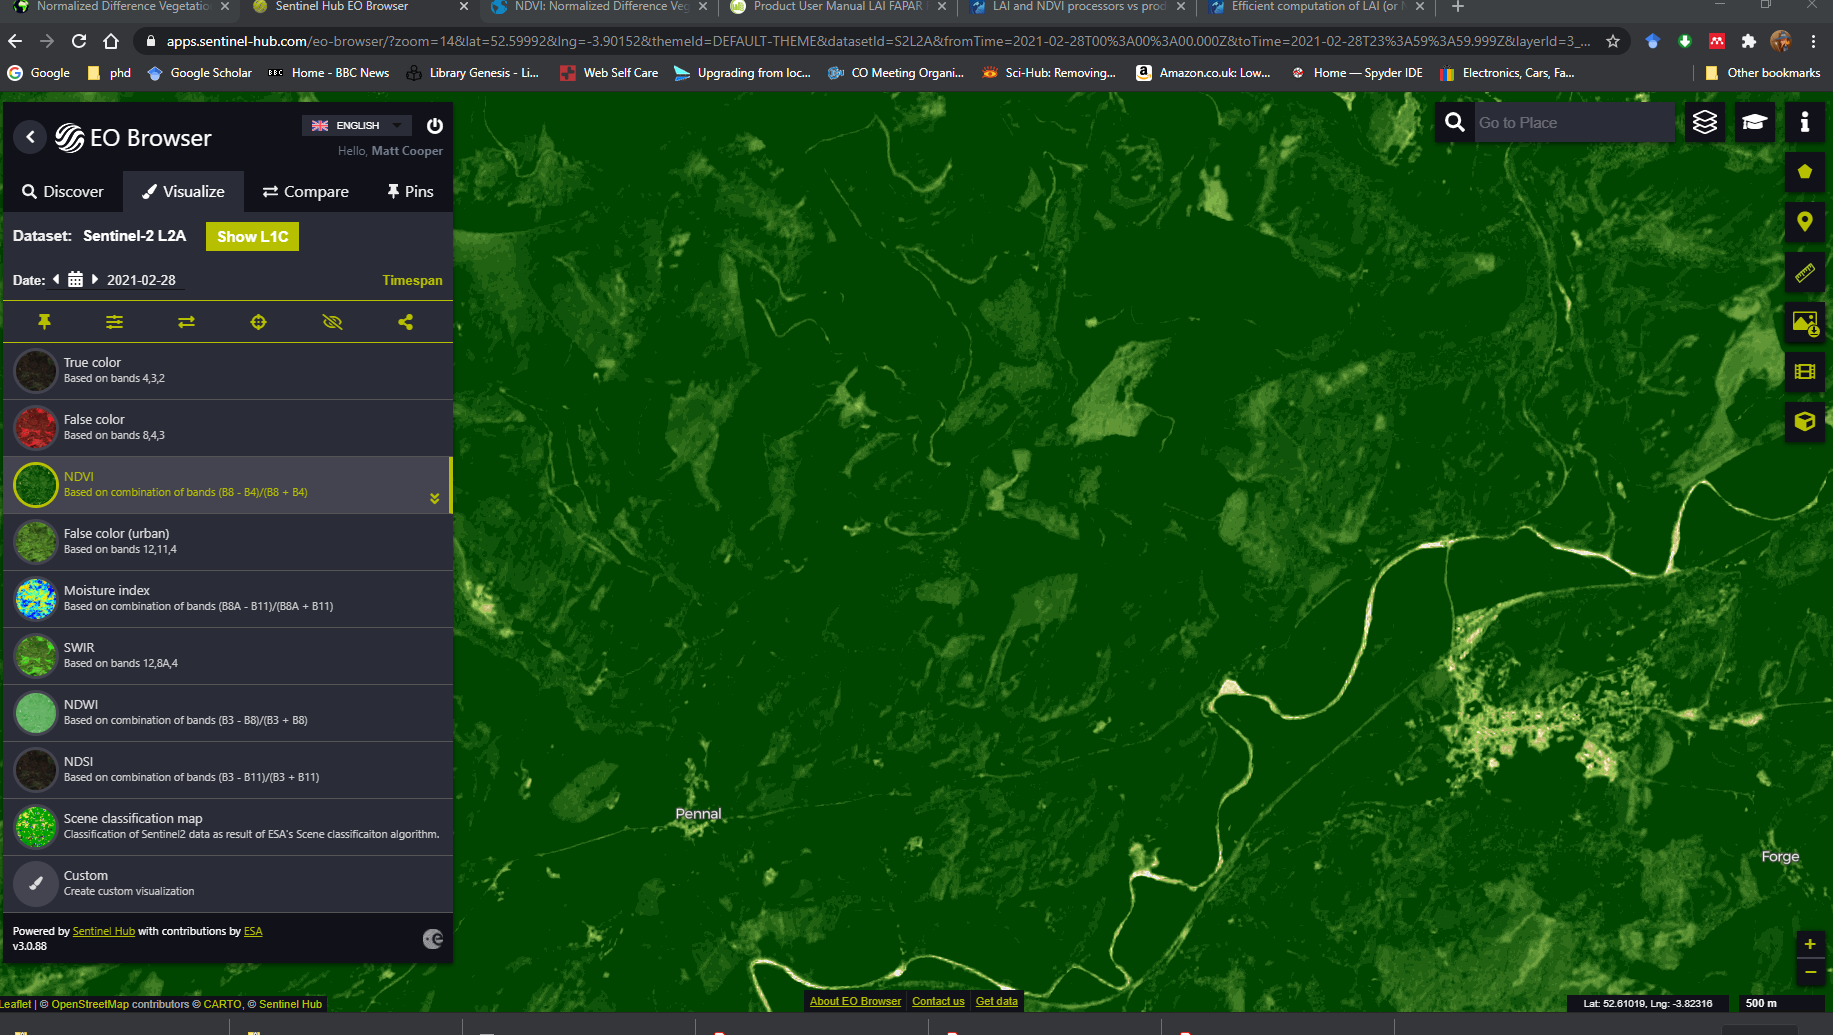
Do you know this EO Browser? I think they also produce NDVI, LAI, etc.
Thankyou @abruescas yes i have been looking at that browser, but confess to being a little confused by it’s output.
I viewed the NDVI as shown here:
then I downloaded that image, specifying all (raw) bands and imported the resultant .tiff files into SNAP
I thyen produced a subset of bands 2,3,4, and 8 and used them to display the rgb image and ndvi (calculated as (b8-b4)/(b8+b4) as can be seen here:
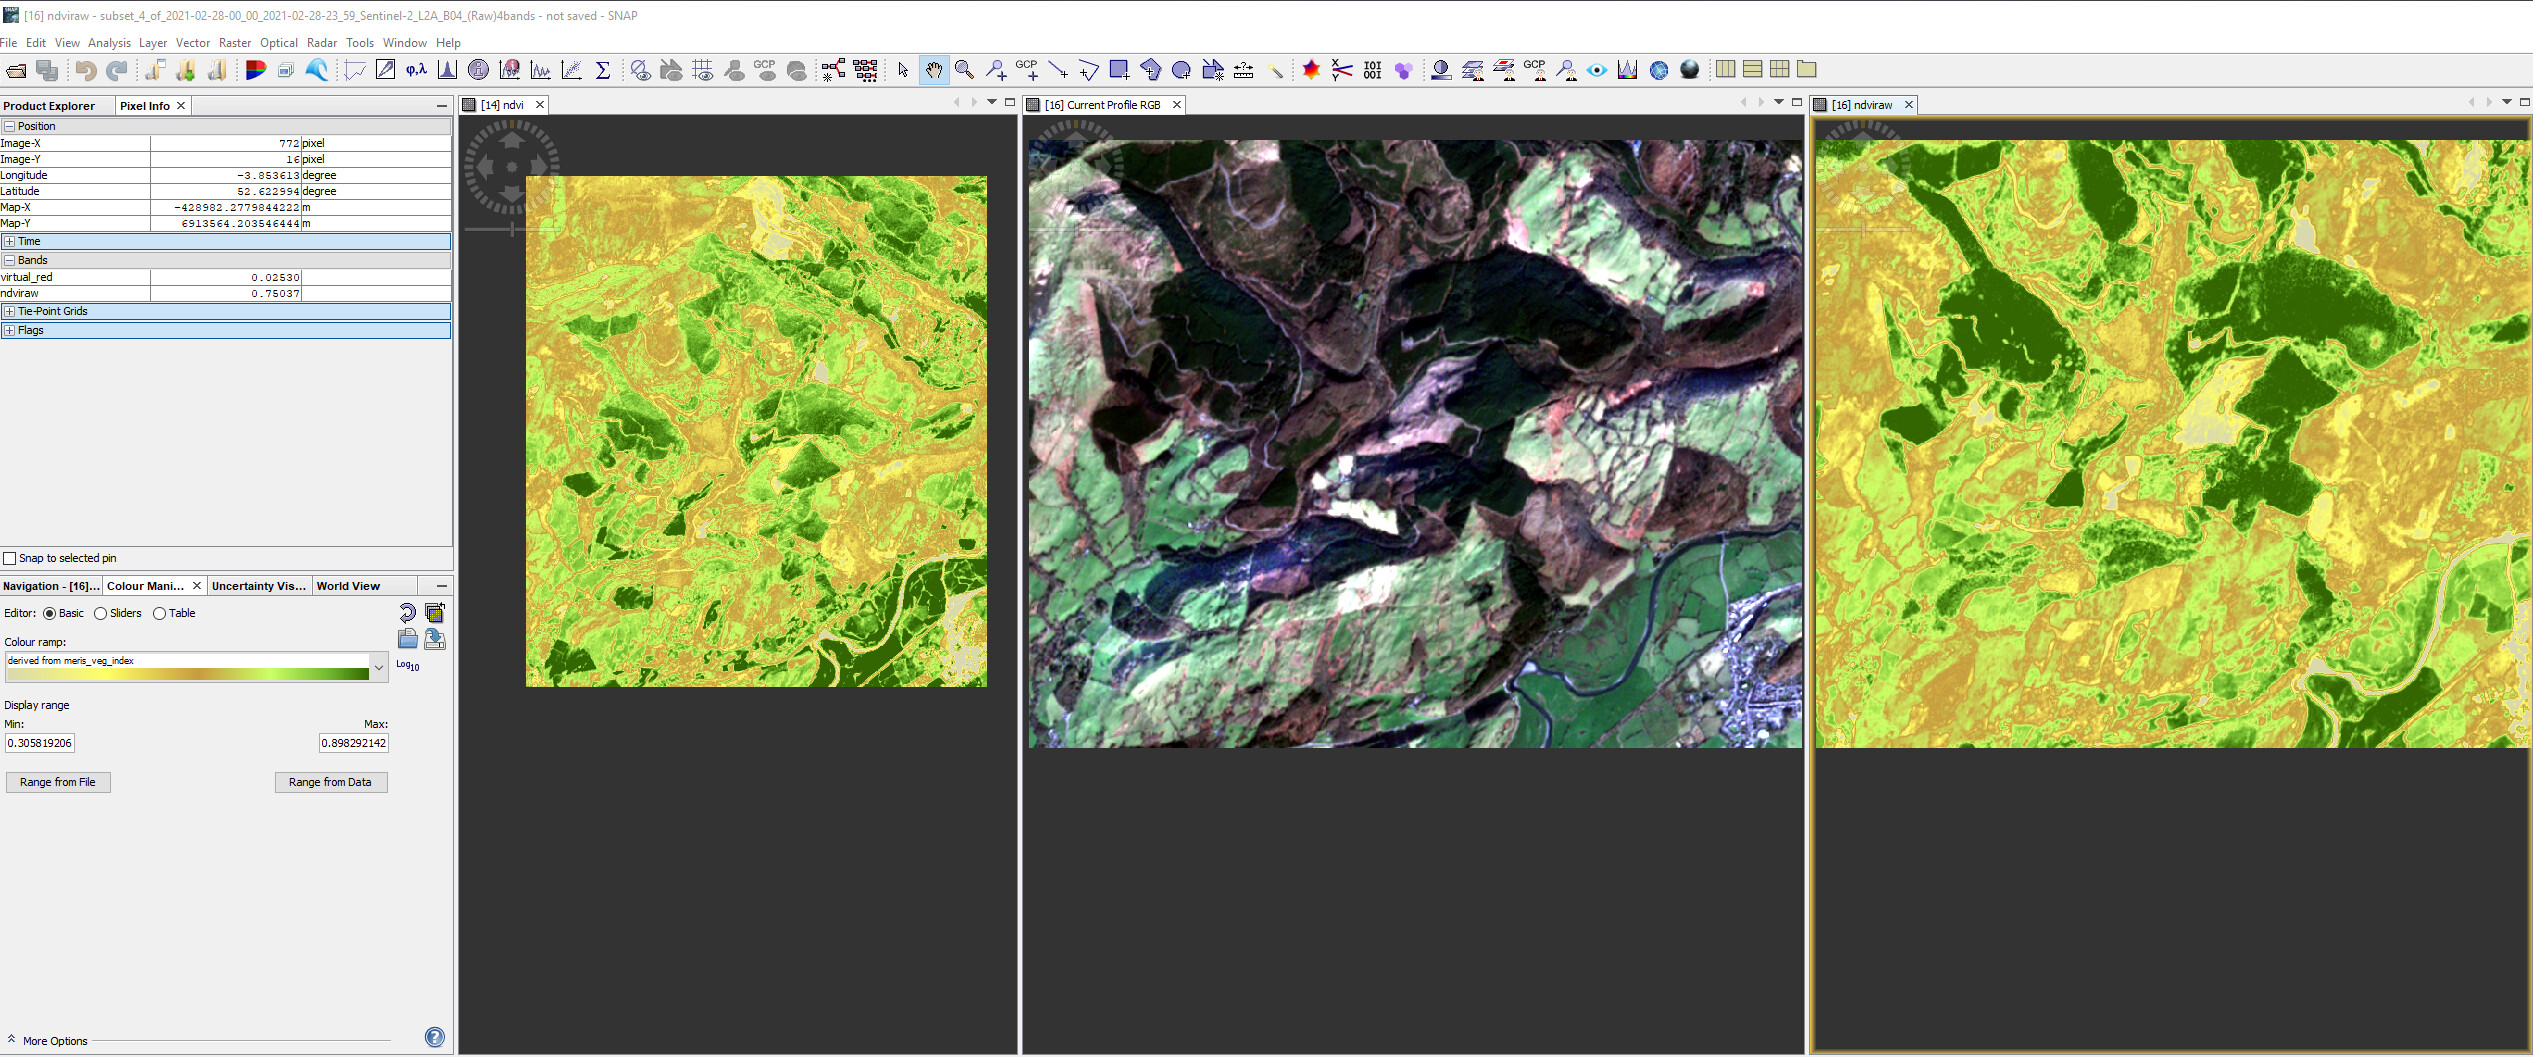
The left hand image is as subset of sentinel 2 data (calculated NDVI values) for 23/03/2020 which was generated with exactly the same coordinates as the other two images, but is apparently smaller.
as you can see the ndvi values in the right hand image are very different to those displayed in the EO browser.
My main issue is that in my PhD I will have to justify why i didnt use the ‘product’ values of LAI or NDVI as offered by the Copernicus land service website: https://land.copernicus.vgt.vito.be/PDF/portal/Application.html#Browse;Root=513186;Collection=1000322;Time=NORMAL,NORMAL,-1,-1,
unless i can compare these data with the data i can calculate using raw sentinel images using SNAP I will find it hard to justiify my reasoning!
if you want to visually compare two products, please make sure that you apply the same color stretch to both in the Color Manipulation tab:
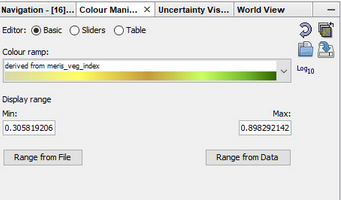
Otherwise, the colors represent different values.
Besides that, an NDVI calculated from PROBA-V (the link to the Copernicus site) will inevitably be different from an NDVI calculated from Sentinel-2 data because of the spatial and temporal resolution of the products. So a direct comparison will not be possible in terms of justifying your input data.
A well-intentioned advice: As you pursue a PhD which heavily relies on data from earth observation and methods of image processing, I would recommend to attend a course which deals with fundamental principles. My feeling is that many things that confuse you at the moment (starting with data formats, data types, spatial data representation, sensors, coordinate systems…) could be avoided with a bit more solid understanding of general things.
Thankyou @ABraun
Yes I always apply the same colour,
I take your point about attending a course, but as you can imagine, that has been a little difficult over the past year!
Do you know if the ESA offers any courses of the type you mentioned?
usually, the ESA Land Training is great, but unfortunately, the application deadline has passed for this year’s course.
Thanks @Jan but that course is no longer running 
and thanks @ABraun, the next course is in september, I need answers before then!
maybe one of you could answer this question?
the screenshot shows three images i have produced. [2] is from a product downloaded from the product library in SNAP, [3] and [4] are from the EO Browser. all are the same date.
I downloaded the raw data from the EO browser (al bands) and subset each one using the same coordinates.
I understand that [2] is S2B_MSIL1C , [3] is Sentinel2 L1C, and [4] is Sentinel2 L2A , but dont understand why they are different sizes?
I have the cursor synchronisation on, and although the screengrab did not pick up the position of the actual curaor, the target square that shows the curso position is in the same place on [3] and [4] (it was at the same point in [2])

to me it looks liek they have different
- spatial resolutions which would explain that the view cannot be synchronized (known issue of SNAP)
- different coordinate reference systems (WGS84 from EO Browser and UTM from Copernicus hub)
Ah, I understand (i thibk  )
)
It would seem the take home message here is: Stick to one source for camparisons!
Thanks