I generated an NDVI image on S2 images using bands 4 and 8.
The image looks good but the toolbox seems to react very slowly.
It takes several minutes to refresh the image… which does not occur when I am visualizing only the original bands.
How have you generated the NDVI image? Have you used the operator or did
you just do band maths?
Have you saved the result to disk? Are you on the latest beta release?
Hi Marco,
I used the “Thematic Processing” menu. As far as I remember saving or not the results to disk did not change the behaviour, but it may be worth checking again. As for my version it is 2.0-beta-06.
Cheers,
I am working in 2.0-beta-07 and I don´t have such problem after performing NDVI process.
If I save it to disk than it works absolutely normal. If I don´t then rarely it can take some time to refersh the image, but no more than few seconds.
Can you also give us the size of the image and what format you used to save it.
I also guess the input product is L1C, but if not, please tell, so that we can try to reproduce.
Currently there are only L1C products on scihub, but later L1B should be distributed also after the commissioning phase.
The toolbox is capable of reading both L1B and L1C user products.
Manually (using Band maths GUI tool) we have had no problems with creating a range of vegetation indices as virtual bands.
However, using Beta 7 we are still unable to carry out band maths using the Graph Builder.
For us this is critical as we need to move to testing bulk processing based on the saved gpt files.
Can you provide us what you have done with the Graph Builder? The graph xml file and how you use it with gpt.
At which point is your use case not working?
@jmalik can you have a look at the log output Tom provided.
It seems it is related to the S2 reader.
java.lang.NullPointerException
    at org.esa.s2tbx.dataio.s2.l2a.Sentinel2L2AProductReader.addBands(Sentinel2L2AProductReader.java:324)
    at org.esa.s2tbx.dataio.s2.l2a.Sentinel2L2AProductReader.getMosaicProduct(Sentinel2L2AProductReader.java:305)
    at org.esa.s2tbx.dataio.s2.Sentinel2ProductReader.readProductNodesImpl(Sentinel2ProductReader.java:77)
    at org.esa.snap.framework.dataio.AbstractProductReader.readProductNodes(AbstractProductReader.java:169)
    at org.esa.snap.gpf.operators.standard.ReadOp.initialize(ReadOp.java:93)
@TomL can check you xml.
You are using ‘>’ charcter in the expression, they are known to cause problems They have special meanings in xml.
Just replace it with ‘>’. Probably this should have been done by the Graph Builder.
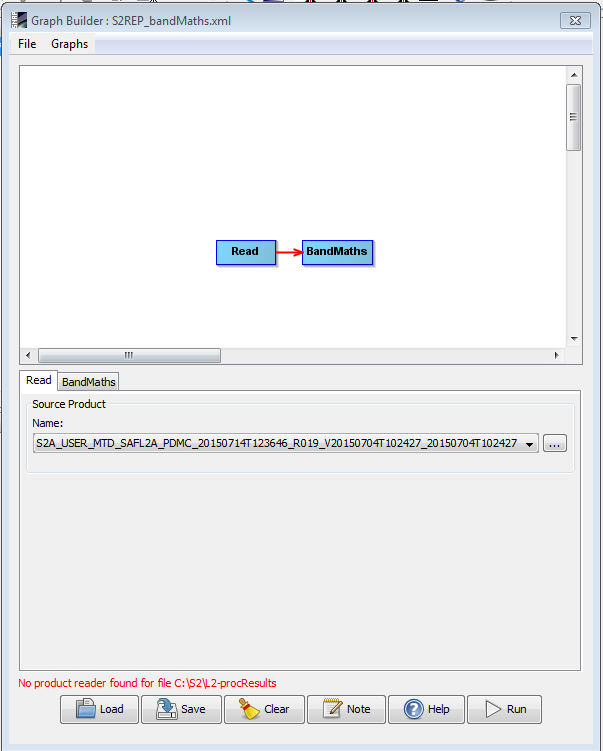
Two other things. In your attached image I see that you haven’t configured a Writer node. However, the generated xml should work. And I see the error message “No product reader found…”. This is strange because there is a source product selected.
I am just seeing ‘>’ twice in your reply so cannot see the difference.
FYI, the XML example was not generated using the GraphBuilder.
We have 2 problems;
band maths on S2 data using the GraphBuilder GUI tool
separately, running the xml on command line
We get the “No product reader found…” message when trying to processes a Level 2A product via the GUI GraphBuilder. This seems odd as the Level 2A product opens fine manually and I can do the Band Maths manually as well.
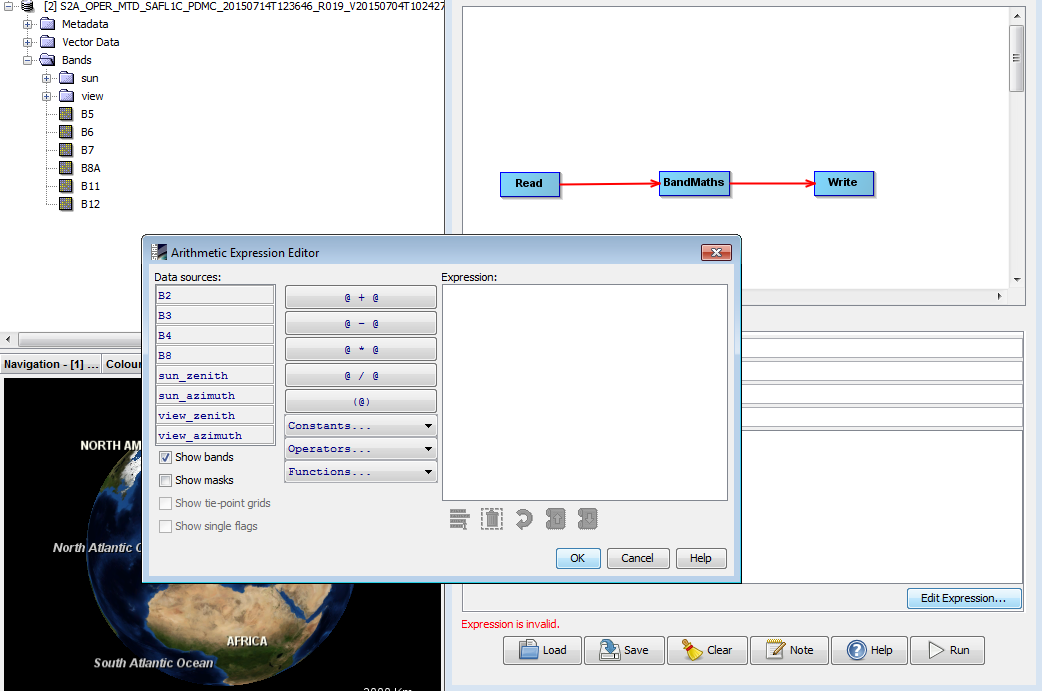
I have tried with a Level 1C product and it does not complain about a product reader but now the BandMaths expression is invalid as the 10m bands ar made available but our expression uses the 20m bands (see below)
Sorry, didn’t noticed the escaped character was replaced.
So next try. Replace it by >
The problem with the products is probably that there is currently no product reader which reads all bands on a single resolution. You can either have all bands at multiple resolutions or only the bands at a certain resolution (see https://senbox.atlassian.net/browse/SIITBX-116).
To read the 20m bands with the graph the following might work:
Add
<formatName>SENTINEL-2-MSI-20M</formatName>
to the parameter section of the read node. It should look like the following.
I just loggued the error on our bugtracker : https://senbox.atlassian.net/browse/SIITBX-127
I’m currently working on reading all the bands in all the readers, I’ll test that afterwards.