Poor v8.0 Performance

Your screen dumps are almost unreadable on a laptop screen. It would be much better to cut and paste as text, or attach more complete files. With java code the first thing to check is differences in memory settings. Have you checked the impact of using the same “writeEntireTileRows” setting?

Finally, it is worth noting that SNAP 8 uses the OpenJDK runtime, a result of Oracle’s recent license changes. The OpenJDK effort has put priority on correctness over performance. I’m not sure if they are interested in reports of performance regressions at this stage. If your organization has a paid Java license you might be able to try Oracle Java. There are also high quality Java JDK’s from Redhat and others.

Interesting that v7 is 11x faster, with 1/2 the CPU utilization.

@gnwiii How would you propose switching SNAP to use another java version on linux to test performance difference? Maybe SNAP should not include OpenJDK, so users can select one optimized for their systems?

SNAP 8.0 is distributed with: openjdk version “1.8.0_242”
SNAP 7.0 with: java version “1.8.0_202”

I have 4 other versions on my CentOS 7:
java version “1.8.0_121”
openjdk version “1.8.0_275”
java version “14.0.2” 2020-07-14
openjdk version “15.0.1” 2020-10-20

But none of these other Java installations have jre. So I downloaded jre1.8.0_281 from Oracle and replaced SNAP 8.0 jre. I will post results comparison soon.
mv /opt/snap_8/jre /opt/snap_8/jre_dist
ln -s /opt/jre1.8.0_281/ /opt/snap_8/jre

You should also publish your graph if possible so we could investigate. On our set of test graphs 8.0 is on average significantly faster than 7.0 (~20%). Performance of most operators was improved but some degraded significantly.

@mengdahl I just reread your post on DEM bottleneck. I use a larger DEM for TF to avoid black holes caused by topography and DEM edges, and a smaller DEM for TC. So bottleneck might not apply.

You method for changing the JRE should work. As well, many Java applications recognize environment variables (JAVA_HOME or JRE_HOME). You may want to look for a way to add -showversion to the Java command-line so you get a record of the Java version.

There are alternate garbage collection algorithms such as Shenandoah. RHEL 7.4+ ships with OpenJDK 8+ that includes Shenandoah as a Technology Preview. Use to -Xlog:gc+stats examine differences in gc across different JRE’s.

1 Like

Long graphs generate more overheads and are usually less efficient, at least according to the studies I’ve seen. Of course, YMMV, one needs to find a good compromise-lenght for one’s particular application & system.

My system was not idle, so the small differences running SNAP 8.0 with different Java versions are probably insignificant. ie: Open or Oracle Java version did not change SNAP 8.0 performance. I was able to verify the Java version that was executing. SNAP 7.0 still the fastest. I quickly executed these tests on CentOS 7 with an all in one Sentinel-1 GRDH to Gamma0 graph:

SNAP 8.0.2	               minutes:  real, user, sys
openjdk (SNAP 8.0) 1.8.0_242		 10.0, 77.4, 14.5
Java (Oracle download) 1.8.0_281	 10.2, 79.5, 13.0
Java (SNAP 7.0) 1.8.0_202		      9.6, 78.5, 13.3
openjdk 15.0.1				         10.3, 77.5, 10.8

SNAP 7.0.2: Significantly faster, and less than 1/2 the CPU resources.
Java (SNAP 7.0) 1.8.0_202		      7.7, 34.3, 7.7

The mv with ln method of switching Java versions works, but passing jdkhome to snap is probably better. However, gpt only uses JDK_HOME when …/snap/jre does not exist.

snap --jdhhome /usr/java/jdk-15.0.1
mv /opt/snap/jre /opt/snap/jre_dist ; export JDK_HOME=/usr/java/jdk-15.0.1 ; gpt ......

Use of JDK without JRE, like jdk-15 above, executed with a couple severe, and warnings. All 8.0.2 Gamma0 products were identical.

I have not yet, because I use a operator not graph.xml to execute gpt, I need to build a graph include write operator so that I can test the impact. I will do that later.

I use “gpt Interferogram -t target.dim” instead of “gpt graph.xml …” to process data. I don’t know if the graph will bring faster performance, in my experience, step by step single operator always faster than graph, that why I choose operator not graph.

Interesting, I guess you have very fast storage so the extra I/O between each step does not penalize you too much.

I use /dev/shm (memory) for Java cache: So “storage” is fast?
Early results are: 8.0.3 appears to be 8% to 25% faster (wall clock), and a few % better on CPU utilization than 8.0.2 on my graphs.

1 Like

That seems like a clever approach instead of going “full RAMDISK”. @marpet would this be hard to implement on Windows as an option? People with 16GB or more RAM could perhaps do this by default.

In theory this is possible but would require some framework changes and updates of the code.
Some of the changes are planned anyway.
But instead of letting SNAP do some magic here, it is better if this is configured externally by the user, I think. Such functionality belongs more to the OS.
Also, often the disk performance is not the limiting factor but the CPU processing time.
We can keep this in mind for the future development.
It is a nice approach when doing big processing and a valuable tool when operating processing chains.
However, I’m not very much in favour of integrating this into SNAP.
But someone might convince me.

There are many ramdisk implementations for Windows, but
Windows Caching Behavior has an arguably better approach in the form of “temporary files”: files created with both FILE_ATTRIBUTE_TEMPORARY and FILE_FLAG_DELETE_ON_CLOSE reside in memory (but may be written to disk if the system experiences high memory pressure).

Could the installer do this at the OS-level? Tinkering with external RAMDISK-software is not in every user’s skillset. How about gnwiii’s proposal above? Would of course require extended testing to see that no weird side-effects pop up.

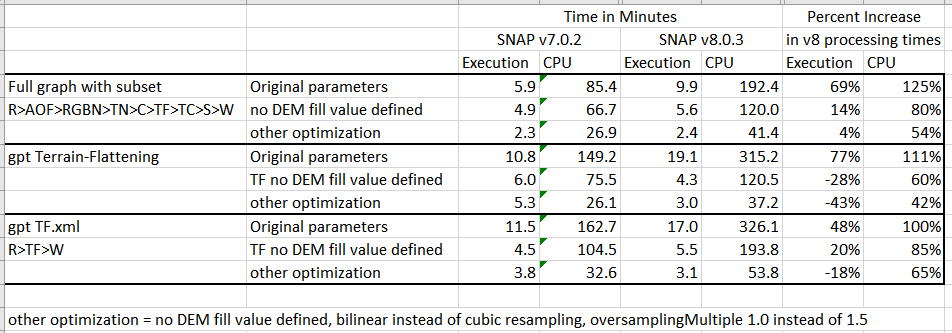
I was not able to identify any specific format, set of parameters, or config file changes that effect the relative performance difference between v7 and v8 for Sentinel-1 geocoding (the first graph below). Performance of the individual modules tested was relatively the same between v7 and v8, with exception to Terrain-Flattening. When including Terrain-Flattening v8 is uses ~twice the CPU time as v7.

The “other optimization” parameters should provide an acceptable compromise solution for migration of production to v8, that results in increased production 2x over v7 with original parameters.

This seems like a bug: Adding externalDEMNoDataValue more than doubles the execution and CPU time of gpt Terrain-Flattening and gpt TF.xml. Leaving this out in areas near sea level could result in issues since this defaults to 0.

gpt Terrain-Flattening beats CPU utilization of gpt TF.xml by a fair amount. They should be nearly identical since both read and write BEAM-DIMAP files. Is this an example of graph overhead?

The full graph with subset refers to:

Writing an intermediate product after Calibration, and then running:
Terrain-Flattening only from gpt command line: gpt Terrain-Flattening -Ssource=.......
and a Terrain-Flattening only gpt script, below, from command line: gpt TF.xml
image

Original parameters uses these TF parameters:

  <demName>External DEM</demName>
  <demResamplingMethod>BICUBIC_INTERPOLATION</demResamplingMethod>
  <externalDEMFile>n42w108_dem.tif</externalDEMFile>
  <externalDEMNoDataValue>-32768.0</externalDEMNoDataValue>
  <externalDEMApplyEGM>true</externalDEMApplyEGM>
  <outputSimulatedImage>false</outputSimulatedImage>
  <additionalOverlap>0.0</additionalOverlap>
  <oversamplingMultiple>1.5</oversamplingMultiple>

TF no DEM fill value is with the same parameters above, without defining externalDEMNoDataValue.

Other optimization uses these TF parameters:

  <demName>External DEM</demName>
  <demResamplingMethod>BILINEAR_INTERPOLATION</demResamplingMethod>
  <externalDEMFile>n42w108_dem.tif</externalDEMFile>
  <externalDEMApplyEGM>true</externalDEMApplyEGM>
  <outputSimulatedImage>false</outputSimulatedImage>
  <additionalOverlap>0.0</additionalOverlap>
  <oversamplingMultiple>1.0</oversamplingMultiple>
1 Like

Thank you for reporting, @s0sh0rt. We are currently working on the performance of the Terrain Flattening operator and hope to release an updated version soon.

Thank you. Please also note that running without externalDEMNoDataValue is not possible, since any area at 0 elevation is masked. 0 really should not be the default for DEM no-data.
Please address the performance issue when externalDEMNoDataValue is defined, or at a minimum define a different default DEM no-data value, -9999 or -32767 or -32768?

Performance update on SNAP 8.0.8 / S1TBX 8.0.5 running the graphs below compared to v7.0.2.
First number is wall clock, second is user CPU:

v7.0.2   24 min,  145 min CPU
v8.0.5   91 min,  575 min CPU

v7.0.2   5 min,  60 min CPU
v8.0.5   43 min,  289 min CPU

v7.0.2   1.5 min, 10.5 min CPU
v8.0.5   2.3 min,  21 min CPU

Saving the output after the calibration step and just running Terrain-Flattening using this graph:
image

v7.0.2   6.2 min, 36 min CPU
v8.0.5   12.6 min,  86 min CPU

Bottom line: Terrain Flattening in v8 is still much poorer performance than v7. Our production capability is unable to switch to v8 as a result. The products from both v7 and v8 are visually identical, but slightly different numerically.

2 Likes

A solution to the v8 performance issue in this case is to implement TileCache between Terrain-Flattening and Terrain-Correction as in the graph below. Thank you @marpet. TileCache users note.


With TileCache, v8 runs in ~1/2 the time, with ~1/2 the CPU and memory resources as v7. This is a huge improvement of v8 over v7.
Use of -Dsnap.gpf.disableTileCache=true as noted in the TileCache document used 20% more CPU and the same memory as without. So disabling the global cache did not increase memory usage as noted in the TileCache document. Running the graph:

v7.0.2     ~8 min,  130 min CPU
v8.0.5     98 min,  930 min CPU  wo/TileCache
v8.0.5      5 min,   50 min CPU  w/TileCache
v8.0.5      5 min,   62 min CPU  w/TileCache, -Dsnap.gpf.disableTileCache=true
4 Likes