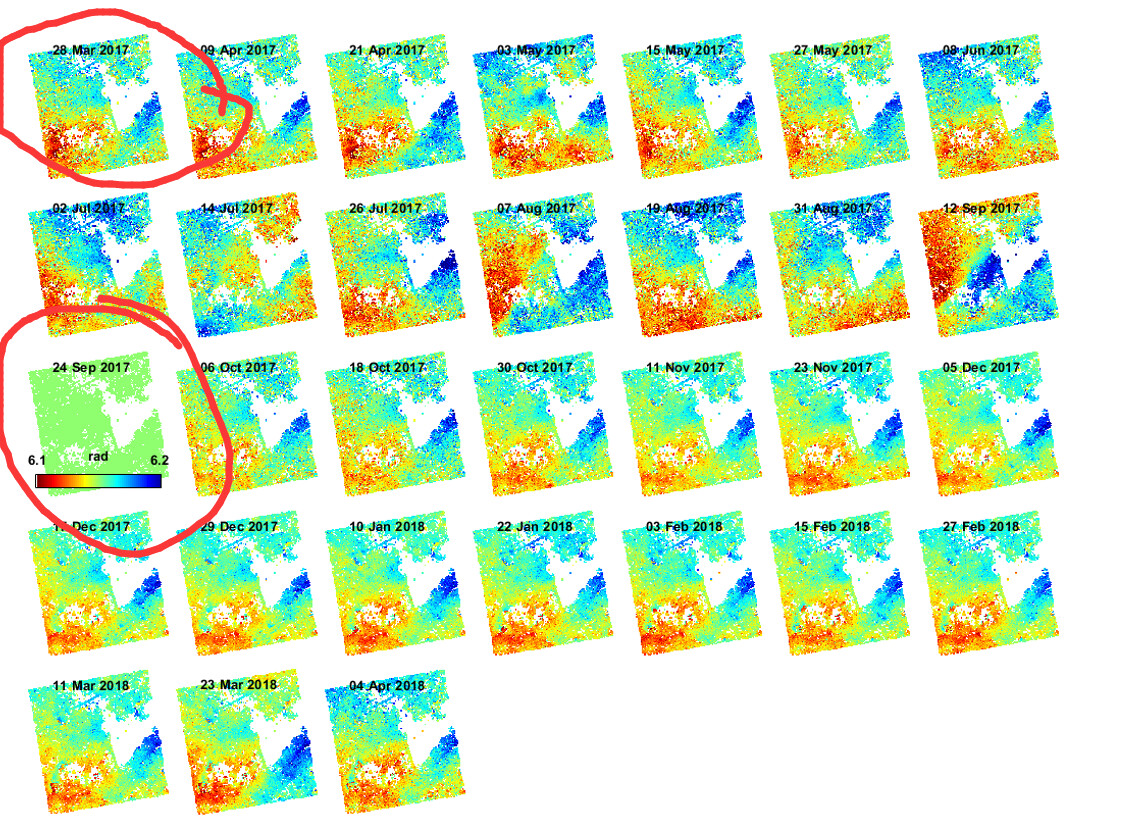
Hello everyone, how can I make the first image green, which means zero subsidence, rather than the master image of 24 Sep 2017.
Hello, I would like to ask how to get the cumulative time series settlement chart. It seems that stamps can only get the result of the annual average settlement rate?
I think this is not a good idea. Because InSAR stack overview command will provide the best master SAR image out of all the SAR images (high coherence and etc), If you want to select master as 28th May 2017 you can do it without using InSAR Stack Overview.
You could multiply the annual average rate by the total duration in years to get the displacement.of this period. This however assumes constant motion over time.