if you create bands with band maths they are virtual in the first place (not written on your hard drive). Right-click > convert and then save your image by File > Save Product to have it permanently written. It will then be available in the time-series tool in the filter ![]() option.
option.
I haven’t tested it but I remember that I did something similar once.
Thank you, it worked.
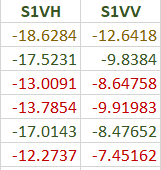
One more thing, there is something I couldn’t understand. I read an article and its name is “Understanding the temporal behavior of crops using Sentinel-1 and Sentinel-2-like data for agricultural applications” by Amanda Velossa et al. They used VH/VV ratio but it seems they actually used VH-VV. See below:
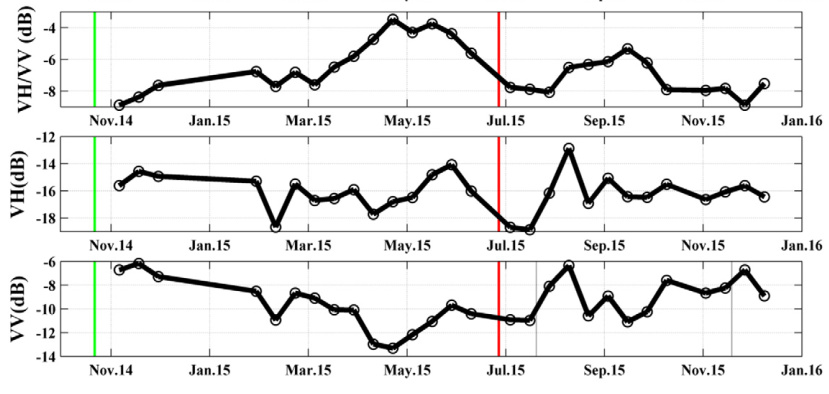
How this can be possible? Am I missing something?
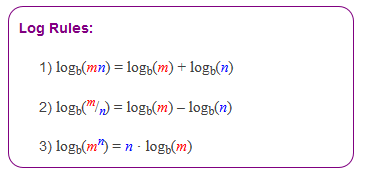
I have not read the article but I guess this is due to the relationship between linear and logaritmic
A ratio in linear is translated into a substraction in dB scale. Note that the figures in your post are in dB scale.
I hope this helps
2 Likes
Thank you very much to both of you.
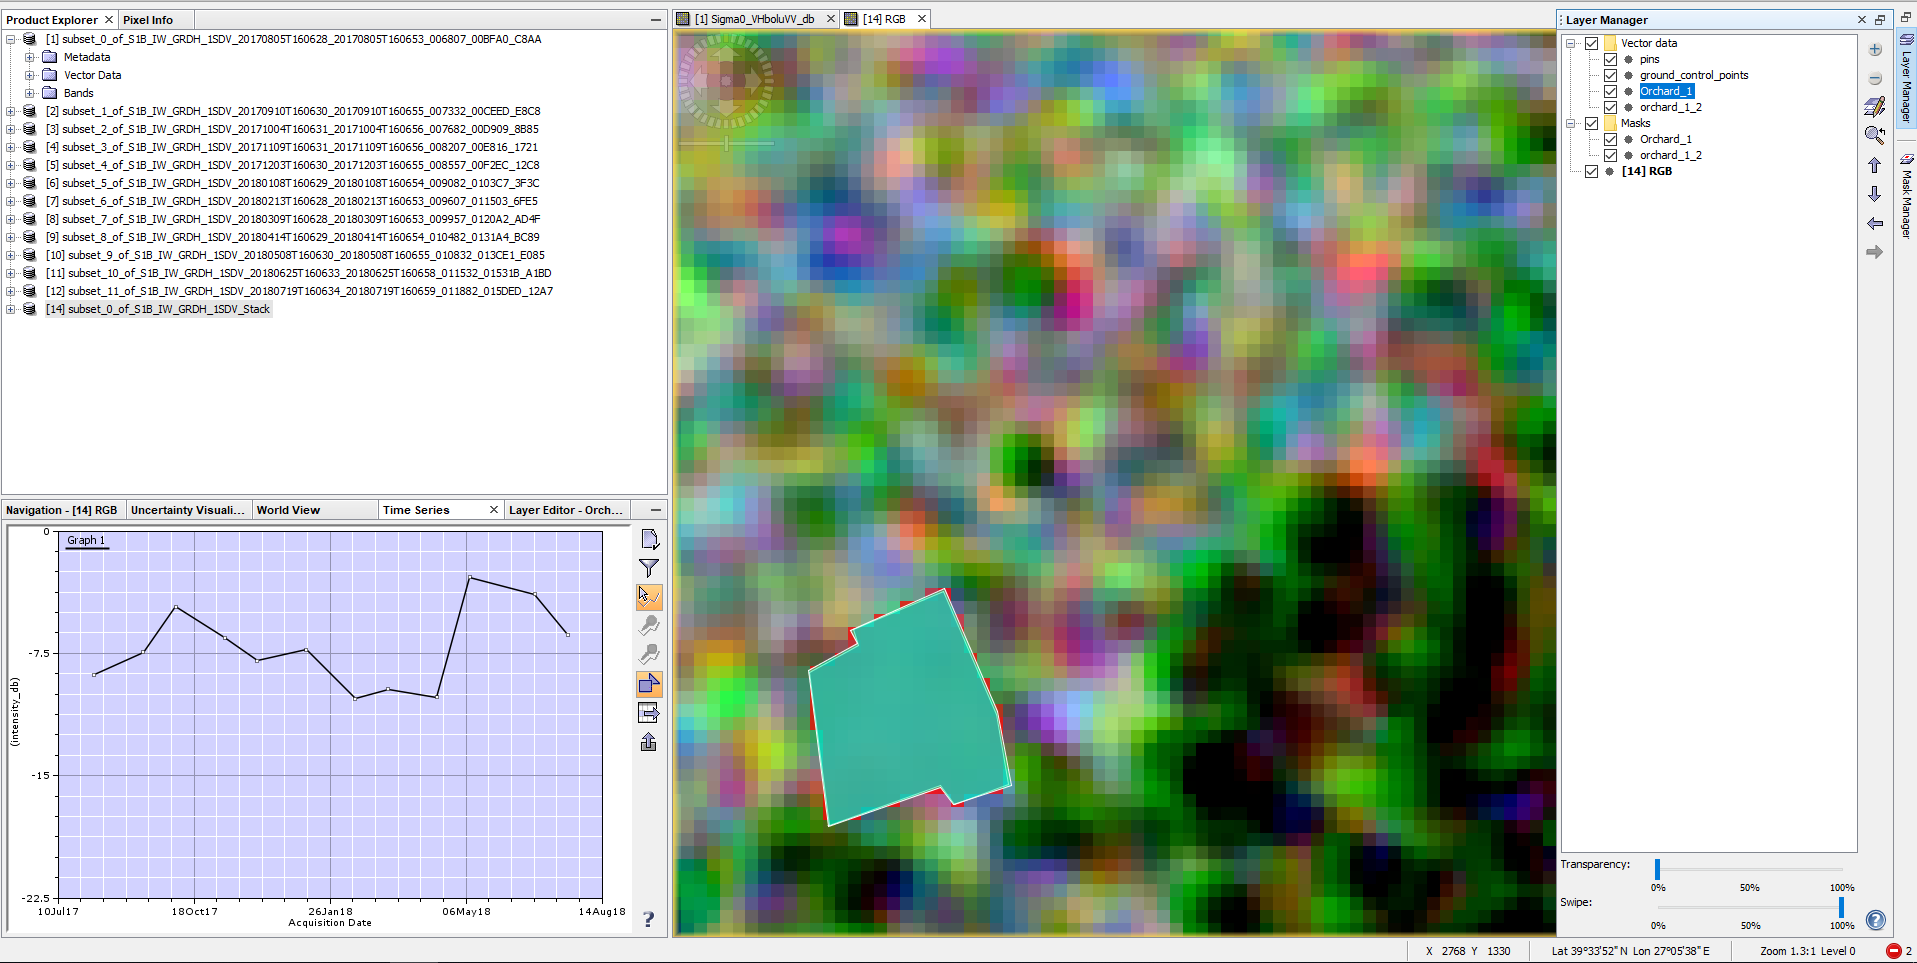
In SNAP, does it possible to have a polygon’s mean backscatter value? My backscatter values are just a pin’s (pixel) value inside the polygon but all pixels have different values in the polygon. It would be more accurate analysis If I have mean backscatter values of a polygon, right?
I tried both importing as a shapefile and drawing a polygon as vector data but It doesnt work at all. It only visualizes the cursor’s backscatter values when the curser is on
cursor on
cursor off

any ideas?
you have to select the corresponding polygon with the normal mouse.
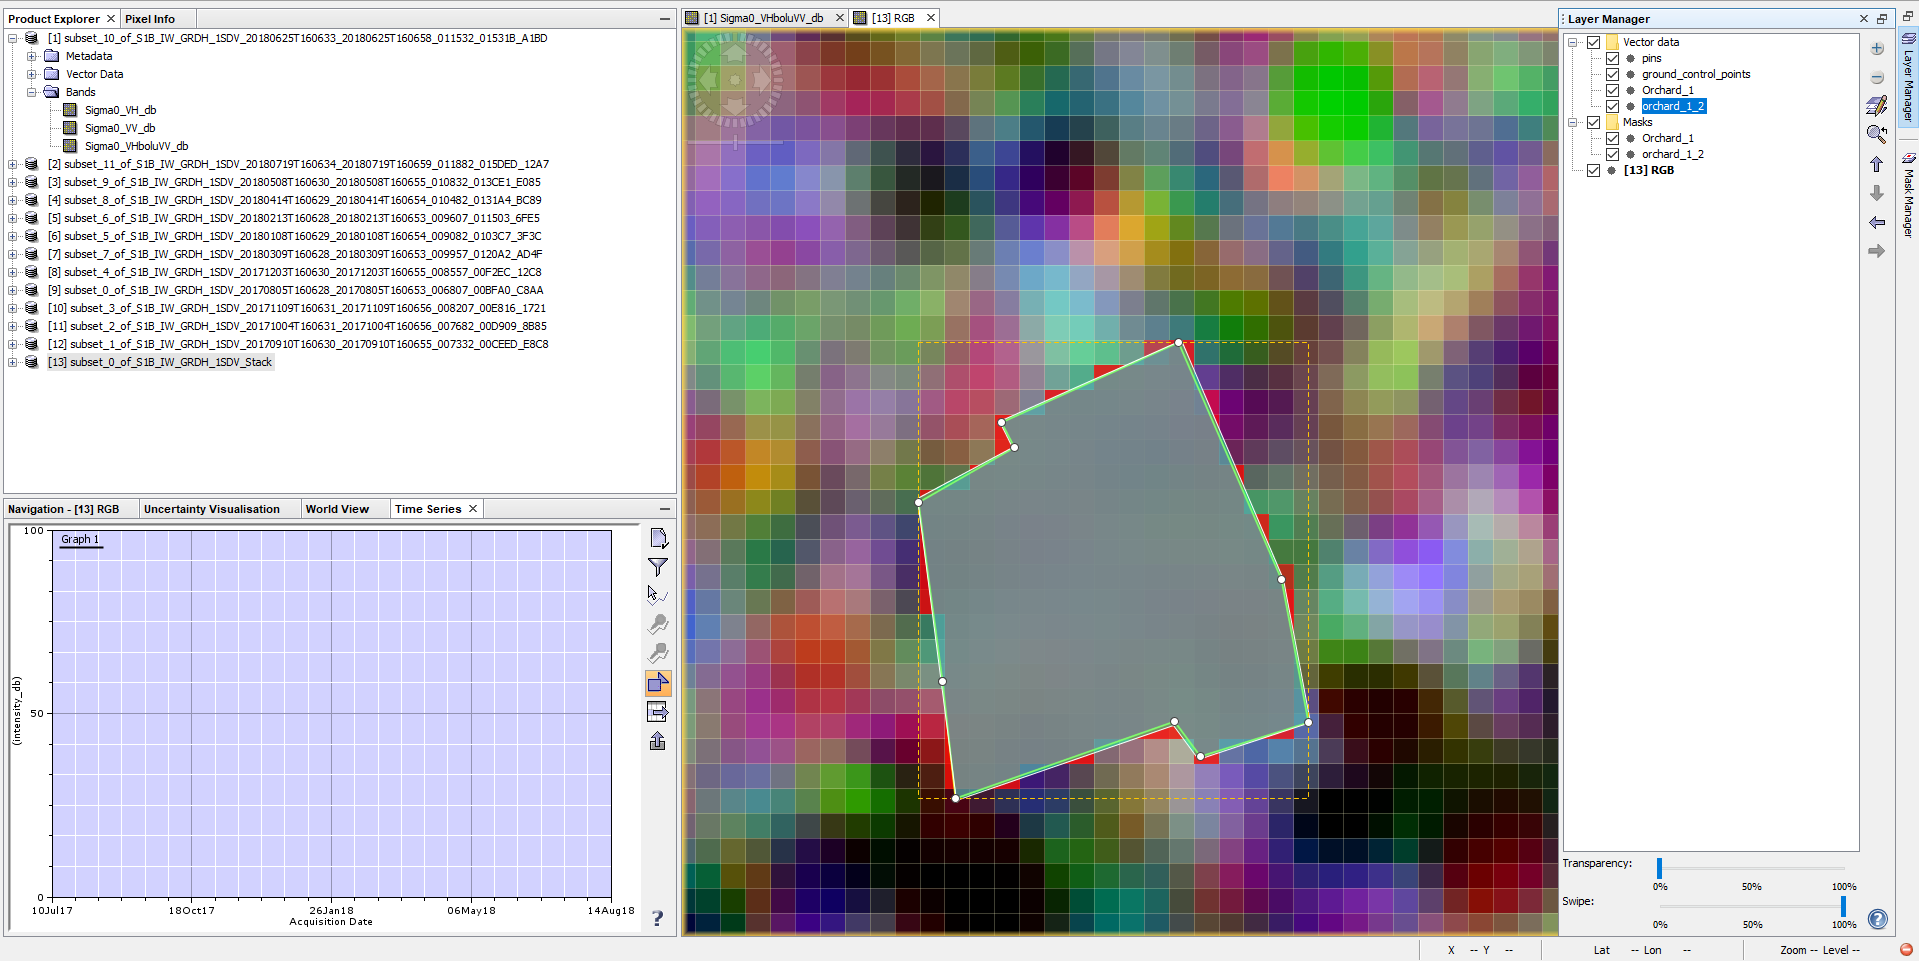
did you again select it in the filter dialogue?
yes sure, but still doesnt work. even if I select all bands, it is the same. It only works when the cursor on.
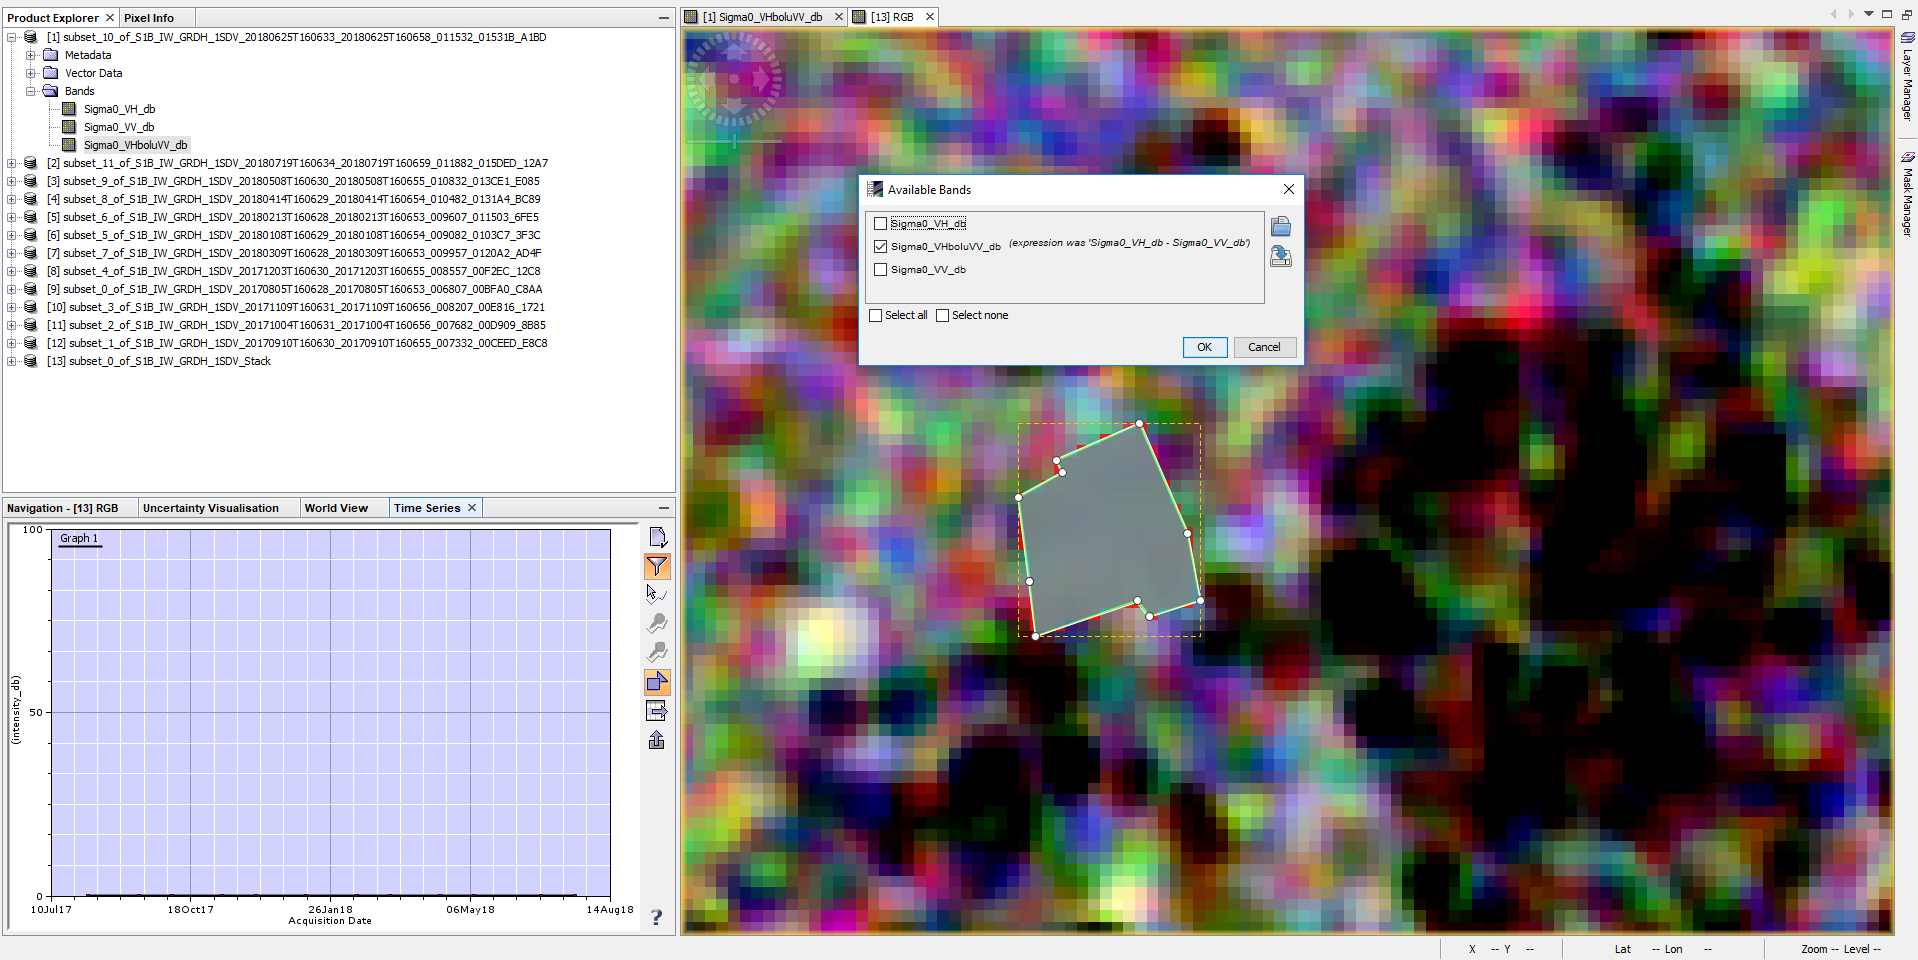
from your screenshot I see that it is still a virtual raster
Sorry but I dont understand what I need to do. How can I solve this problem? Could you tell me step by step?
I explained already above and based on your comments it worked: Sigma0 VH/VV analysis
![]() this indicates that your product is still virtual.
this indicates that your product is still virtual.
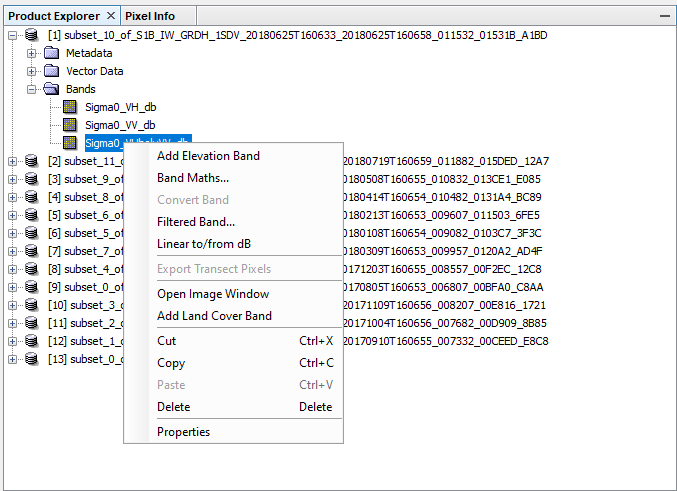
Are you sure that it is still virtual? Because I already converted it before and now I think it doesnt seem as virtual. When it is virtual, there would be “V” symbol on the band icon as below, isnt it?
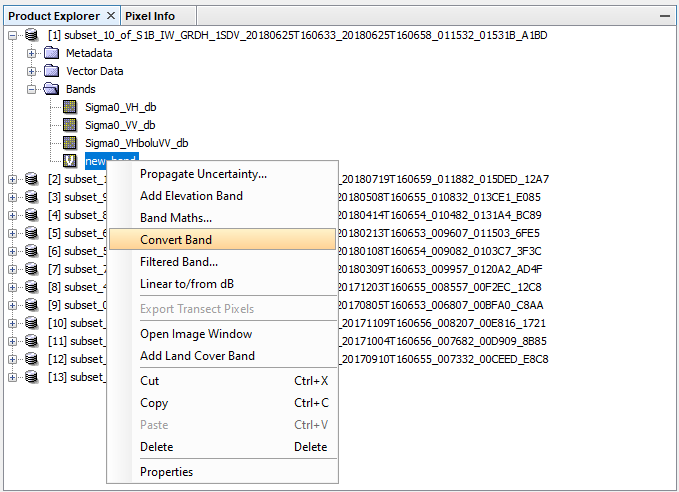
but when I right click on my band, it is like this:
you are right. Even after it is converted and saved there is “expression was”.
But it works anyways - I just tested it. I created a band “ratio” from VV/VH in 6 Sentinel-1 images.
ratio as point from cursor

Switching from cursor mode to polygon mode (I imported a shapefile with two different polygons)
also ratio

Things to test if it doesn’t work at your side:
- Make sure that the name of the ratio is consistent over all products.
- Try importing the vector as a Shapefile instead of drawing it (and, again, save the product)
- Import the shapefile into all used products.
I think I am missing something but I dont know what.
If I made mistake about name or descriptions of bands, It even wouldn’t show when the cursor on. For this reason I thought that there are some problems due to shape files. I created another shape file and even I didn’t change the location of it. Then I imported it to all products and saved all products. Finally, I opened time series and tried again and again but unfortunately, It didn’t work.
Thank you very much for your help.
If any other opinions from you or others, please let me now.
Hello,
I have sigma0 VH and VV values in an excel sheet. How can I calculate the VV/VH, VH/VV and (VV+VH)/(VV-VH) indices from these values? Can I simply subtract the 2 values for the ratio?
Hi. These values are in dB (calculated using 10*log10(values not in dB)). So yes if you just want VV/VH or VH/VV you can just subtract the dB values. However if you want to calculate (VV+VH)/(VV-VH) than I suggest you convert the dB values to non-dB values and apply this equation.
1 Like
Hi, ABraun! When I using band maths to create the absolute displacement band from the relative displacement band and a reference point, I put the band maths expression like “displacement_VV+0.00462”, and I success getting the absolute displacement band and I saved the file as you said!
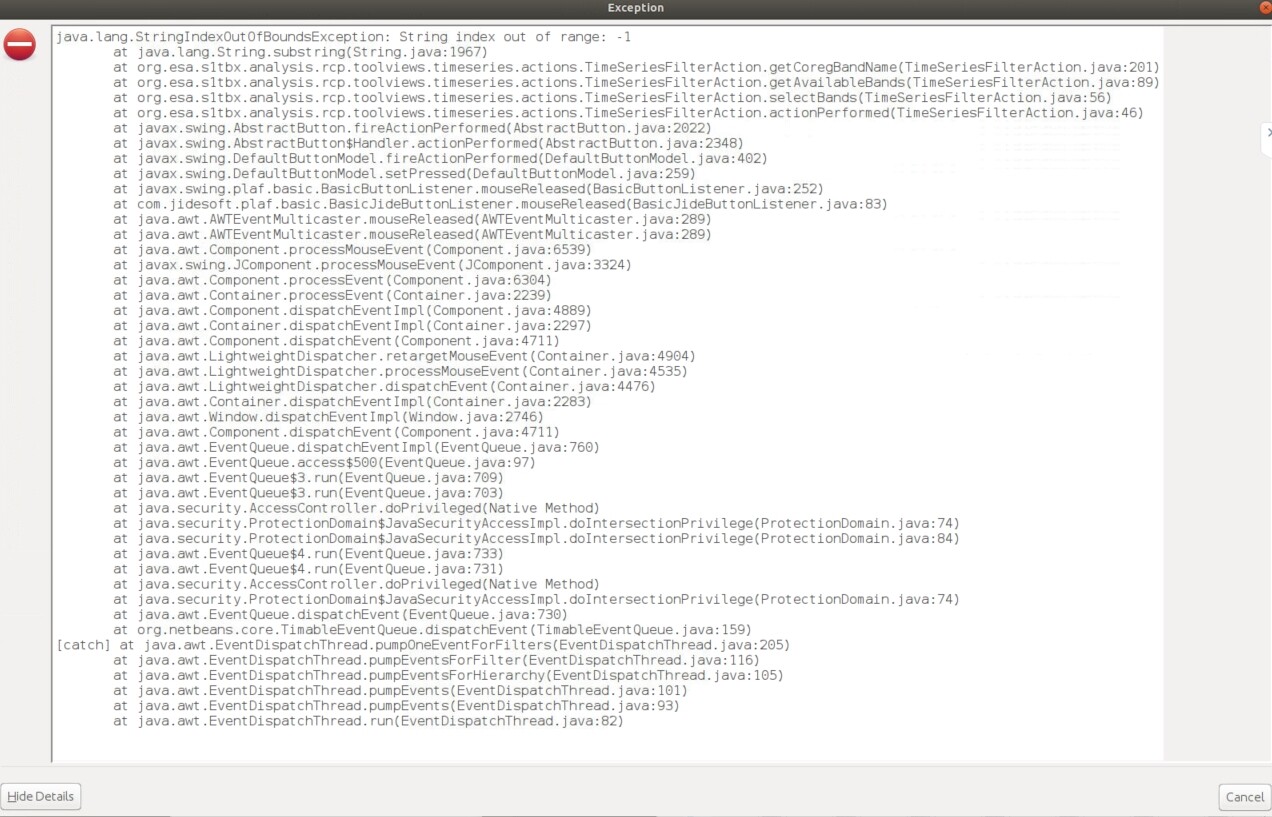
But when I put all products in the “Time Series Analysis Settings” and click the “Filter bands” button, I got an error as follows. I have no idea what cause the error, any advice will be appreciated!