Statistics Raster Problem

Hi!

I am doing some NDVI plots averages. Before getting the V6 SNAP version, plots averages csv where for each plot.

But now I think I am having each pixel value in the csv (lot more of rows)

Two images attached. (First image, 29 plots data, Second image, you can only see one plot and some of the second plot data)

How can I do it to have data as in the first scenario?

Thank you

15

Dear Andres,
did you use the StatisticsOp from GPF to retrieve these statistics? If so, can you show me the command and/or the xml graph that you used?
Best,
Tonio

What do you mean with StatisticsOp

I used Analysis and Statistics (image attached). There I click in the plots that I wanted.

The StatisticsOp is an operator you can run from the command line. You can run it by executing the gpt-file in the bin directory of your SNAP installation. Type gpt -h or look up the entry on the Command Line Interface in the Help for more information on that.

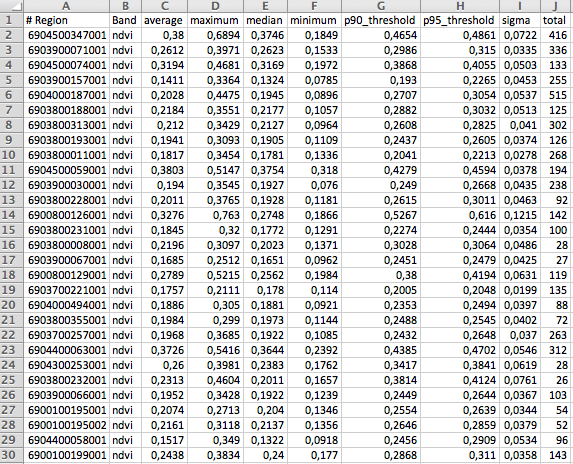
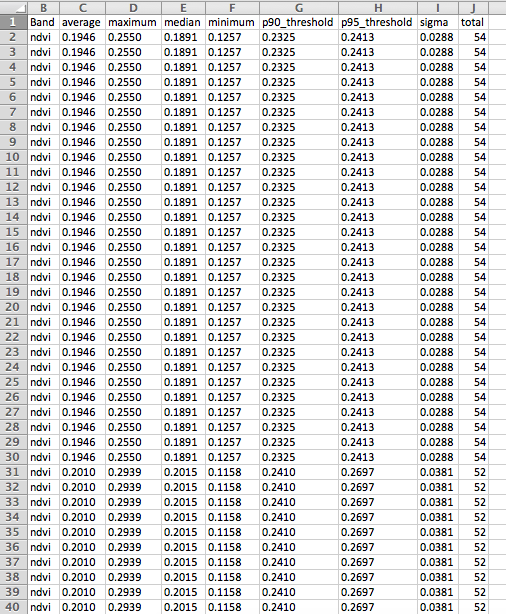
Regarding your issue: I think I found the problem. It seems that all the relevant entries are there, but they are written out multiple times (29 times to be exact, so you end up with 29*29=841 entries). Can you confirm this please? If this is the case, the fix will be included in the next module update.

I confirm that all relevant entries are written multiple times 29*29= 841 entries.

I would wait for the next module update.

When would be next update?

Best regards

Andres

I can’t tell an exact day. But I think you can expect an update in the coming 1-2 weeks.

Thanks.

What I did is delete repetitive values in excel. There is a function in “data” to do it very easily.

Best regards