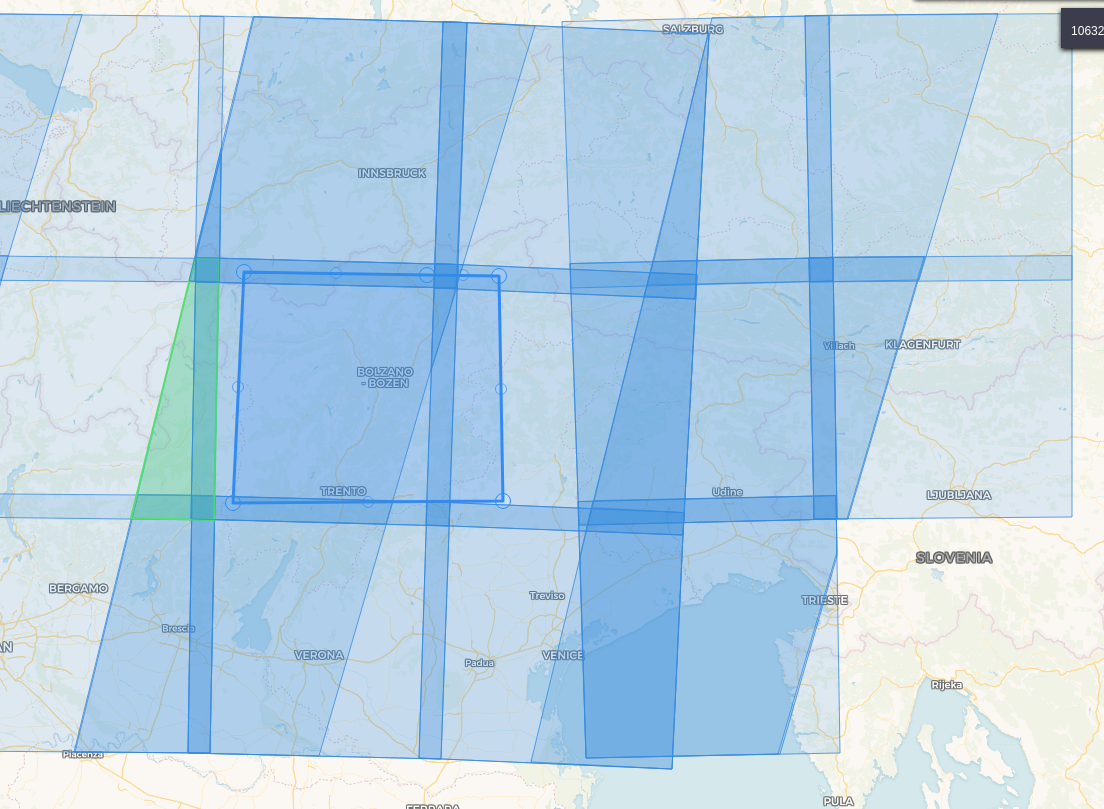
Hi everyone:) I’m really sorry for the naive and less complex question here. I’m kind of new to this and I don’t want to start missing this essential step. Wherever you download S2-data you see the orbits like in the image below. What I don’t understand is what these non-square-parts (like the one in green) are. Is this something to “fill” the gaps from the ascending and descending order? And do all these non-square-parts have their own Tile-identifier, like 32UNU?
Because when I download the data I still get the complete square, just all blacked out, minus this little part.
And as last question: Are there any “good-practices” in order to select proper scenes for my region of interest?
Again, I’m really sorry for this embarrassingly easy question. But maybe someone can give me a hint:)
Thank you very much in advance!
Hello @leko
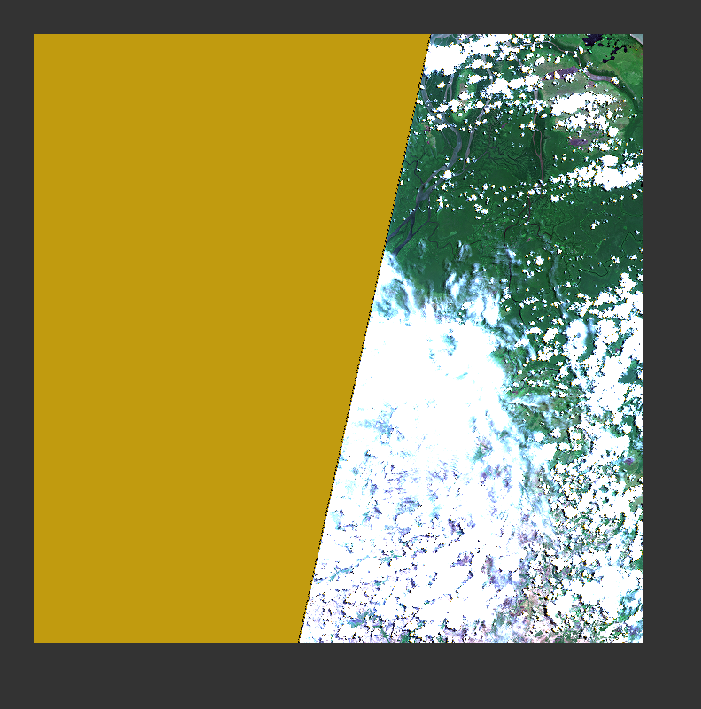
What your image shows is the orbital track of the satellite(s) - diagonal stripes - overlaid on the Tiling Grid. The Tiling Grid splits the Earth into 100 x 100 km squares (representing an L1C or L2A Tile). The swath of the satellite is 290km on ground. If the edge of the swath is within a whole Tile, then that product will consist of the part of the swath within the tile, and the rest of the footprint of the Tile will be represented by NO DATA mask in SNAP:
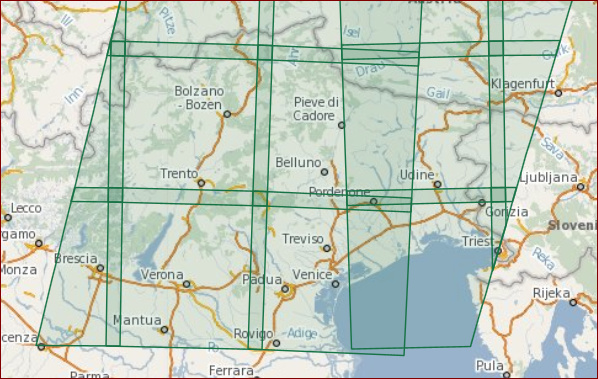
Both the acquisition plans and the tiling grid for Sentinel-2 are available in KML format:
https://sentinel.esa.int/web/sentinel/missions/sentinel-2/acquisition-plans
https://sentinel.esa.int/documents/247904/1955685/S2A_OPER_GIP_TILPAR_MPC__20151209T095117_V20150622T000000_21000101T000000_B00.kml/ec05e22c-a2bc-4a13-9e84-02d5257b09a8
Using these in combination should allow you to predict the Orbits that cover your AOI.
Information on the Tiles and the Tiling Grid can be found in Section 2.7.2 of the PSD:
https://sentinel.esa.int/documents/247904/685211/Sentinel-2-Products-Specification-Document
I hope this is of use.
Cheers
Jan
S2 MPC Operations Manager
@Jan Thank you so much!! Really appreciate this:) I will read through the material you provided. Just one (promised last) quick question: As the tiles are based on the MRGS, only when one of these 100x100km-tiles is fully within the the 290 km swath, it’s entirely without NoData.
But where exactly in the image do I see the tiles? The diagonals are the orbital track and have a width of 290 km. So I guess the green triangle is part of one of the tiles, but only touches the path(?). What I find a little strange is that the if the height of the green triangle is 100km it seems way larger than the width of the path of 290km.
Thanks (and sorry) a lot again!
Hello @leko
No worries. Education is the name of the game. There is no such thing as a stupid question.
The swath in your image is the full width of the darker blue section (Bergamo being just outside the swath in the West, and Klagenfurt in the East). So the swath is a lot wider than the height of the green triangle. There is a gradation in hue because areas in the grid overlap; this is because we are transposing square tiles onto the curve of the Earth; the higher in Latitude we go, the more Tiles overlap.
Here’s full swath in the approximate location of your AOI taken from the CopHub.
As you rightly say; the two ‘whole’ Tiles will be without No Data. The other two are partial, and thus WILL have No Data.
Cheers
Jan
Ah great!! Thank you so much! I think now I got it:)
I’m really sorry Jan, I have one absolutely final question. But there is no need to answer right away!
After downloading several L1C products I have two files that are named the following:
S2A_MSIL1C_20200421T102021_N0209_R065_T32UPB_20200421T111956.SAFE
S2A_MSIL1C_20200421T102021_N0209_R065_T32UPB_20200421T122440.SAFE
They are apparently taken at the same date with the same relative orbit and cover the same tile. Why are there two files if this is the same relative orbit and the same tile? There seems to be quite some overlap if I load the to e.g QGis.
And to follow up on that: If I wanted to create a mosaic for a region of interest, am I right that it is ok to mosaic all files from the same date and maybe create an average of the parts that overlap?
Sorry for the amount of questions:/
Cheers,
Robin
Hi Robin
I think there are two main cases:
- a change in the software processing ‘baseline’ - take the latest
- split tiles - join the two
see an earlier answer to me by Jan and the following discussion:
Sentinel-2: weeding out bad products?
Hi @gbrelstaff,
thank you very much! Sorry that I didn’t found this thread beforehand. I think I more or less got it now:)
Hello Robin @leko
That’s OK. @gbrelstaff’s answer is correct. What you see is the overlap the Datastrips within your Tile.
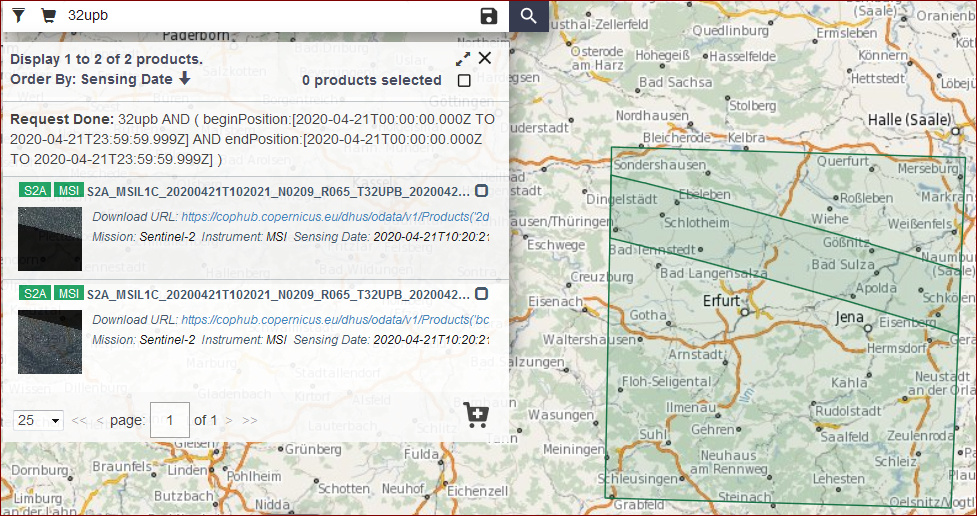
The two partial products are acquired and processed by separate Ground Stations. If you look at the Product details under the Attributes section (clicking on the eye in the options in the Tile listing) you will see that the first product comes from Svalbard (SGS):
S2A_OPER_MSI_L1C_TL_SGS__20200421T122440_A025230_T32UPB_N02.09
Whereas the second comes from E-PAC (EPAE) in Madrid:
S2A_OPER_MSI_L1C_TL_EPAE_20200421T111956_A025230_T32UPB_N02.09
Thus, there are two different Datastrips (SGS and EPAE) in this Datatake. More information on Datastrips and Datatakes can be found in the Definitions section of the Sentinel Handbook User Guide: https://sentinel.esa.int/web/sentinel/user-guides/sentinel-2-msi/definitions
Cheers
Jan
Great, Thanks a lot!! And so creating a mosaic really only make sense for data acquired during the same relative orbit I guess.
Hello Robin
Yes. That would make sense; the characteristics of the same Relative Orbit would be maintained for you then.
Cheers
Jan