yes of course i did 
if i type getparm it shows the correct value and this also gets reflected when running the stamps steps.
yes of course i did
if i type getparm it shows the correct value and this also gets reflected when running the stamps steps.
Is there anybody who can enlighten me? (@thho @ABraun @mdelgado )
i am quite stuck since these ifgs really do not fit the data and implement too much noise.
as @falahfakhri already discussed with me, i have indeed set the parameter correctly and it does reflect when the stamps steps run but somehow the dates still show in the timeseries plots.
I am not sure you are using properly the command to plot the ts not considering the dropped ifgs. Please check the full usage of the ps_plot function.
Still, I am not fun of dropping data for ‘introducing noise’ as it is not really noise, but signal with unknown behavior, and this is what science does… get the answer to the unknowns. Still… try to plot it using full command (or try to restart StaMPS from mt_prep_snap step by removing the data you do not want to)
you mean that even though i have dropped the ifgs i still have to plot like this:
psplot(‘v-d’,1,0,0,[1:3,7:8],‘ts’) ?
And @mdelgado , I am working on a permafrost area so the dates i want to throw out are when ice was still on the ground or dates during heavy snowfall. But thank you for the tips anyway.
I guess so, try to use the full command and let us know.
Cheers
Dear Andy, I’d like to raise this issue once more, concerning python, Would you please to take a look at the following discussions and give me your opinion,
Hey everybody,
i have been trying to see the impact of stamps step 8 on the deformation for a long time now and finnaly figured out it only works when plotting u like this. ps_plot(‘u-dmos’,1) is there any way to subtrac s vrom the velocity plot aswell. i use v-dao, a_linear now but would like to see the difference between stamps and train since the train correction doesnt really impact the data.
Greetings,
Gijs
edit: nevermind, i reread the manual twice and found out the mand o options are mutually exclusive with the s option since they both represent the same error. so v-ds works.
Hey everybody,
coming back on above question i am now trying to compute the standard deviation for the velocity using ps_plot(‘vs-ds’) bur this creates this error:
unknown subtract flags
Error in ps_plot (line 1835)
fig_name_tca=ps_mean_v(ifg_list,1500,value_type(4:end),use_small_baselines,aps_flag);
which i think, has to do with the fact there are 2 s’s in the ‘’.
anyone know how to compute the vs when subtracting the s of step 8.
That means that the type vs-ds is not defined in the ps_plot.m function.
I suggest you to open the file and define it manually, based on previous types which should contain vs and -ds .
does filter should be done in the Interferometric image befor remove the topoPhase,the manual does not shows the filter
Filtering should work better after topo-removal as the interferogram will have fewer fringes.
If you want to perform PSI you should not do any phase filtering, otherwise point scatterers are not any more point, but their influence is distributed.
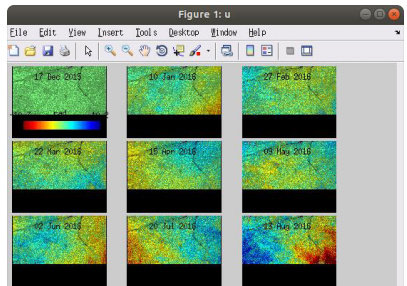
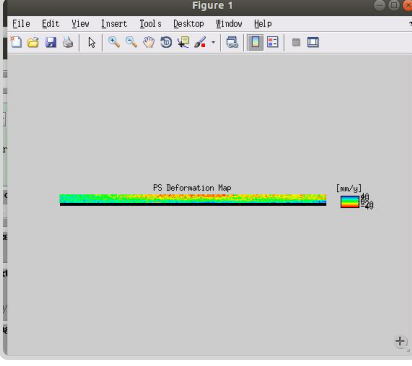
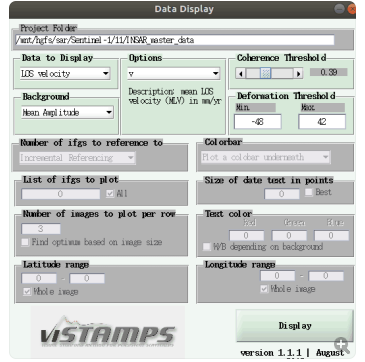
when i use viStamps to disaplay the result(linux),the unwrap phaset shows:

D4P%6O0KG8Y)MOU@E4.jpg)
but the deformation shows:

F0N[I_M0Q)8R.jpg)
my deformation map is a strip,and be differerce from the manual of vistamps, and dont have a map layer
Sorry but I have never used viStaMPS.
Maybe anybody can give any hint?
My only guess it that you had not provided latitude and longitude information.
thank you,and i have try to vilisualizer the result by Stamps Visualizer (successfully) and iVstamps (failed),when i export the all the points to csv ,then load csv by R studio,it is really bad the page refresh very slowly because of the data volume,i wander how i can i control the step when export to csv file like export to a kml file
Well… not sure but indeed viStaMPS has nothing to do with the workflow between SNAP and StaMPS…
So I would suggest the proper forum fhreads that address the different issues.
Good luck with viStaMPS.
Still StaMPS has own commands to convert output to kml files: ps_gescatter
thanks for your reply
Dear mdelgado
i meet a mistake when i creat stack in snap:
after creat a stack of 22 S1 data, i check each intensity image in the stack and found that one(20150924) of the intesity image shows black ,what is happened to this situation?and when i do apply orbit file , all data 's orbit can be found in C:\Users\leslie.snap\auxdata\Orbits directory except the 20150924.so i think the black image was caused by failed to apply the orbit file in this data(20150924),but all of these steps in snap did not have a error message,what should i do?