I found a tool for change detection in S-1 toolbox. I wanted to read more about it - especially about an algorith that is used - but for that tool there is no information in help available from the software.
Would it be possible to get info about some references, e.g. articles, books, websites?
After reading the article I think I need to use polarimetric covariance matrix as an input data. Am I right? That requires Sentinel-1 SLC data. Which type of algorith should I use to compute change detection based on Sentinel-1 GRD data?
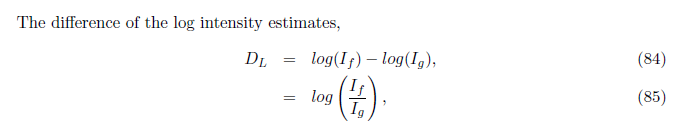
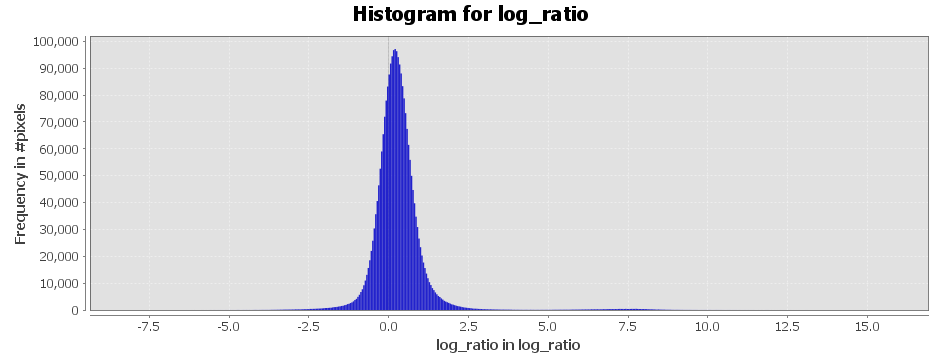
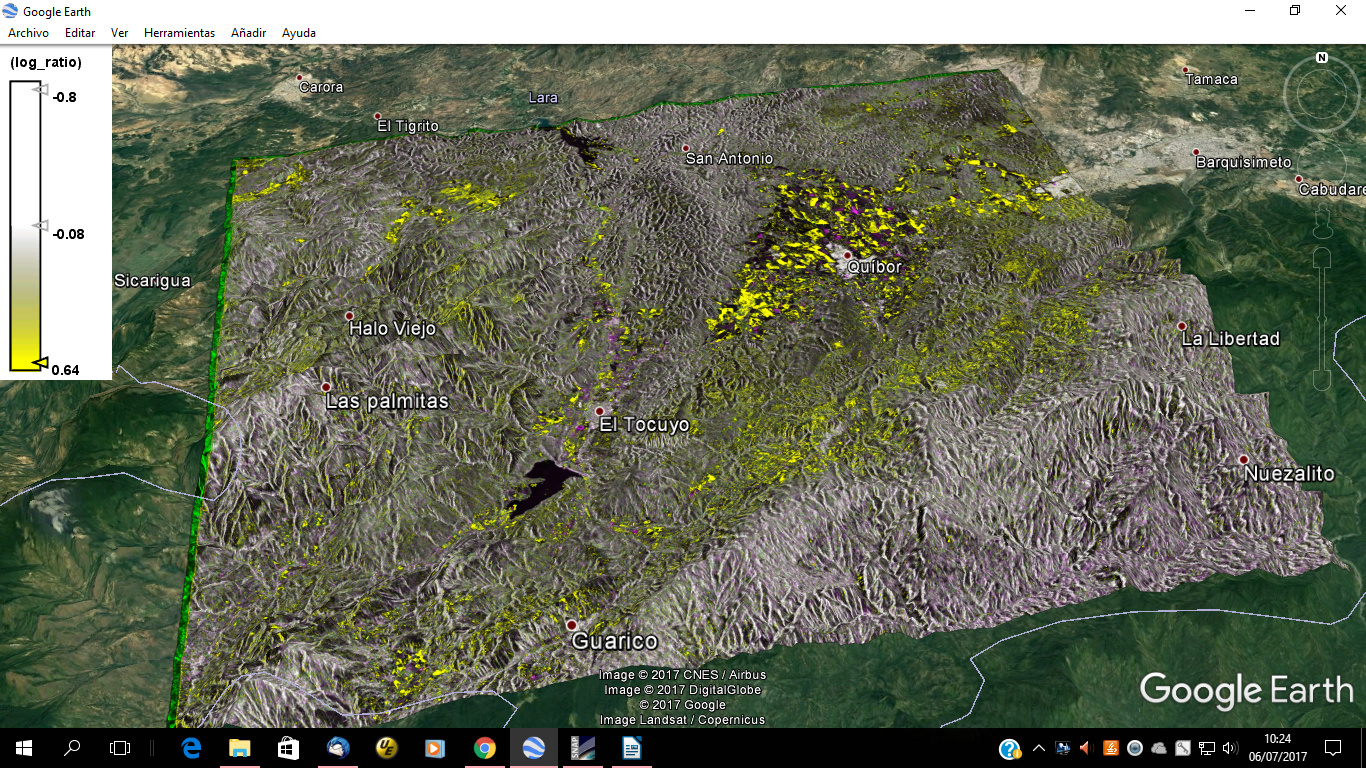
Just to be sure, the “log_ratio” image that is an output of “Change Detection” algorithm implemented in Sentinel-1 toolbox is computed according to eq. 84 - 85 on page 41 (Preiss, M., & Stacy, N. J. (2006). Coherent change detection: Theoretical description and experimental results (No. DSTO-TR-1851). Defence Science And Technology Organisation Edinburgh (Australia)). Is it correct?
I am quoting the following paragraph from Preiss and Stacy 2006:
The mean backscatter power ratio is sensitive to changes in the average backscattered energy in the transduced imagery. The sample coherence on the other hand is sensitive to changes in the speckle noise pattern in the repeat pass image pair. Scene disturbances arising from man-made changes however, can potentially cause changes over a broad range of scattering properties. In [11] the sample coherence and mean backscatter power ratio were used to detect changes in repeat pass ERS-1 SAR imagery. It was found that the areas of disturbance identified by each method did not necessarily agree and each method gives complementary characterisations of scene changes. Therefore both change statistics should be considered to provide a complete description of scene changes. In the context of change detection this presents problems in fusing the detections from the two change statistics to achieve a single combined detection list in which the probability of detection is maximised whilst minimising the false alarm rate.
An alternative approach to discriminating between those regions affected by man-made scene changes and those that are not can be achieved by formulating the detection problem in an hypothesis tesing framework. In this approach the change detection problem is to determine whether pixel pairs Xk = [fk,gk]T,k = 1···N in a local area are realisations of a null (unchanged scene) hypothesis H0 or an alternative (changed scene) hypothesis H1…
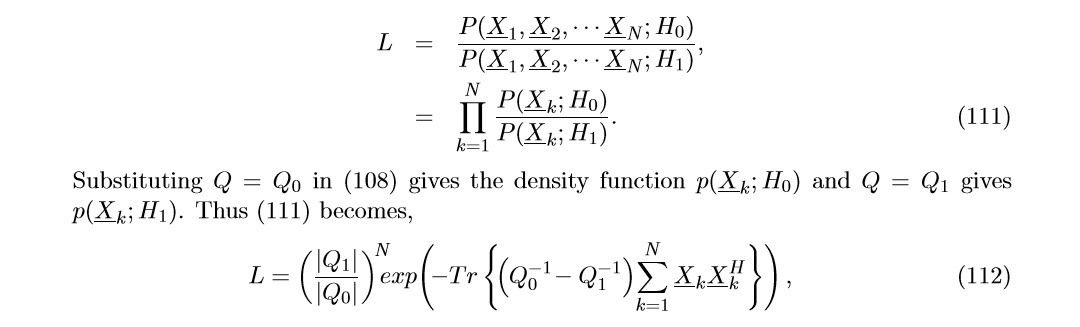
Given a local neighbourhood of N independent pixels Xk = [fk,gk]T,k = 1···N a simple decision statistic for determining whether the pixels are realisations of the unchanged hypothesis or changed hypothesis is the likelihood ratio defined as,
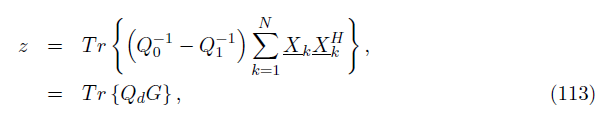
According to the following quoting from Preiss and Stacey 2006: Discrimination between the two hypotheses is achieved by evaluating z over the local N pixel neighbourhood and applying a threshold T. For z > T the pixels are labelled as being realisations of the H1 hypothesis and for z < T the pixels labelled as being realisations of the H0 hypothesis.
@lveci Do you know if the Neighbourhood pixels being accounted for in this way in the snap implementation? @gabrielaquintana77 thanks for your elaboration, could I ask, how are you deciding what the threshold T is?
Also, the change detection function in snap only accepts one input (and I assume compares between bands), but the SLC imagery (that includes coherance as used by Preiss and Stacey 2006 above) has a minimum of 4 bands (C2 matrix); so how does one apply multi-temporal change detection to more than one image in the snap toolbox with SLC?
Is there any software specifications document that could be consulted in order to understand how the algorithm works? For instance is a nxn kernel {mean/sum/…} filter applied to produce the Z-layer output or is purely based on a single pixel ratio?