I am having trouble in converting Sentinel 1 data to a format readable by matlab and arcgis. I tried to convert it to geotiff but when I open the file in arcgis it does not give me a correct range of data. How can I get the correct information by onverting Sentinel 1 to geotiff?
I appreciate if anyboday can help me with this issue.
There are SAR files in this tutorial which can be handled in Matlab. Maybe this helps you to identify the required file structure: https://saredu.dlr.de/unit/dem_matlab
Thank you very much for your email and the information. I work with
polarimetric sentinel 1 data and can visualise them in SNAP software. I
need to convert them to a format readable by matlab. Can you please help me
with this issue?when I convert the files to geotiff I get a wrong range of
values.
as I am not working with Matlab I have no idea, sorry.
But you could write the author of the module, Stefan Auer, how he converted SAR data into *.mat files.
Are the values scaled in SNAP? You can check it, by selecting the band and the choosing Analysis / Information from the menu. If you see a scaling factor and offset you need to apply them in Matlab.
If it is 1 you don’t need to apply.
The factor is used for some data products to scale from integer values to floating point values. In your case you don’t need to care.
When I open the exported geotiff file of sentinel-1 in arcmap it appears as
a RGB bands which is incorrect. Sentinel 1 is a sar product. Could you
please give me a solution to this problem? I probably miss a step before
exporting.
You also need to consider the offset value.
The raw value is then converted as follows:
value = offset + (scaleFactor * raw)
This is often used when data are stored as so called DN (digital numbers) or counts or raw values. Often these values are then just 16Bit integers. After scaling they are in a value range of e.g. [0.0, 1.0]. This is used to save disk space.
After exporting Sentinel-1 images into GeoTiff using SNAP, I have opened it in ArcGIS. It is showing 4 bands can anyone explain about all these 4 bands??
Which steps did you undertake?
SAR data require pre-processing according to what information you want to retrieve. Here is a coarse collection of the most important steps:
@ABraun
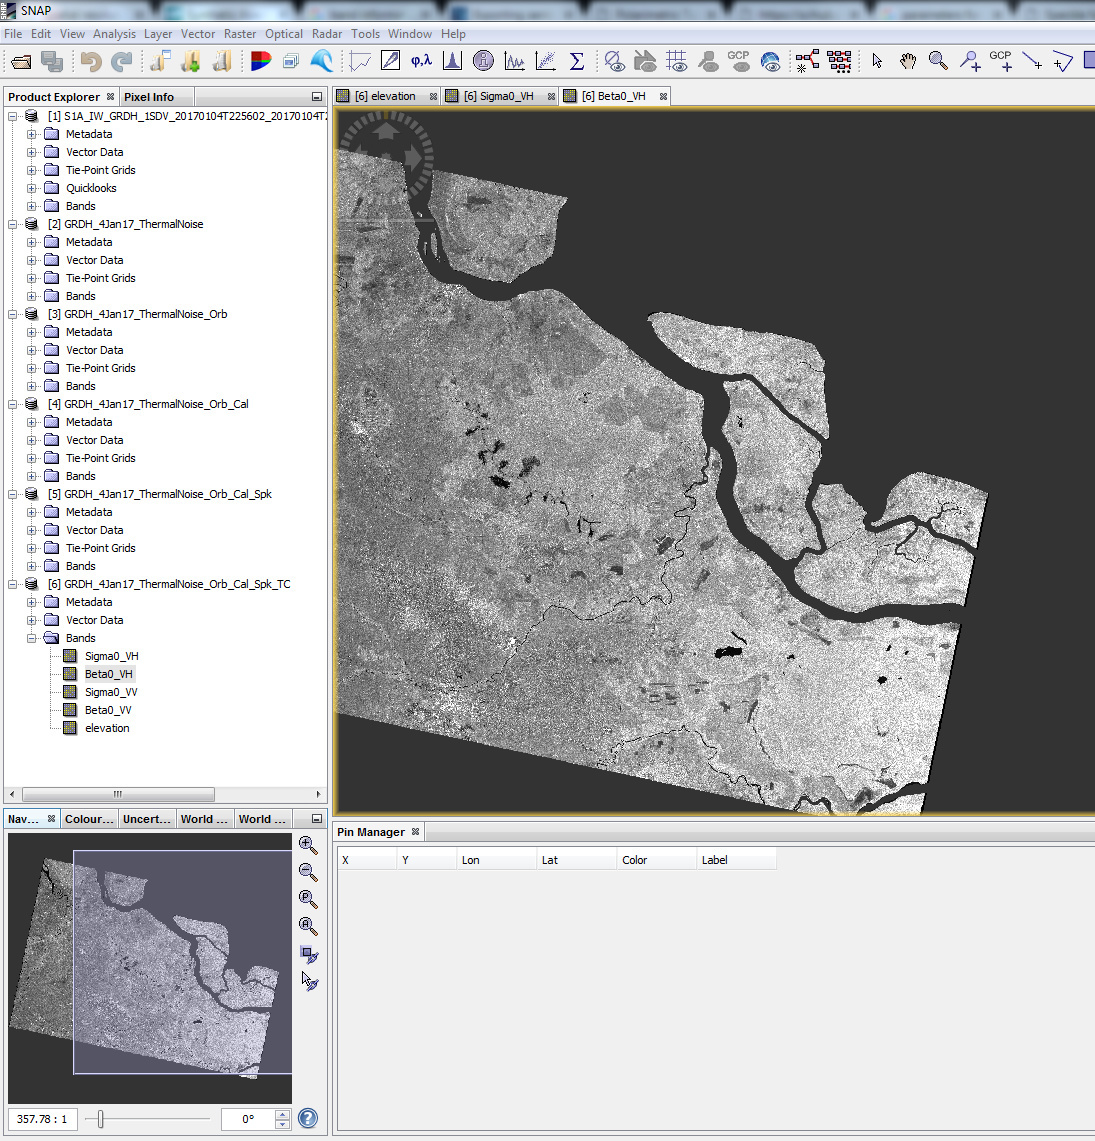
Hi thank you for the enlightenment. I have followed all mentioned steps till the terrain correction and the final products are as:
Bands: Sigma0_VH, Beta0_VH, Sigma0_VV, Beta0_VV and Elevation
Is it correct?
Now when I am exporting it into GeoTif and trying to open it in ArcGIS it is completely black image with 5 bands. All I am trying to do is land cover classification. If the raster resolution comes 10m then I am intending to use clouad mask boundary to get the pixel information in order to use it in Sentinel-2 imageries. Do you think it is the correct approach ??? I would appreciate if you could explain the use of sigma and beta polarisation outputs?
@ABraun
Thank you again And yes I think I have to go through the basics of SAR but since, I have to analyse this as per the scheduled project timeline thats why I am trying to push hard just to get the output asap. I am aware of the fact that without getting into it, it wont be easy for me. Thanks a lot for your help so far. One last confusion I have read somewhere about the RGB combinations which are as Red-VV, Green-VH and Blue-VH/VV and another one Red-HH, Green-VV and Blue-HV. Could you suggest which one is correct one??
correct for what?
There are endless band combinations, each one highlighting certain properties. They depend on the feature of and on the wavelength of the sensor. So there is no right or wrong at all.
Just as in optical data: For example, 3,2,1 (blue, green, red) is related to human vision but 4,3,2 (false colour infrared, blue, green) highlights vegetation in a red tone.
I understand that there is often time pressure in projects and I don’t want to take your interst in SAR data but without some basics you won’t get far because you waste your valuable time with questions that make no sense.
@ABraun
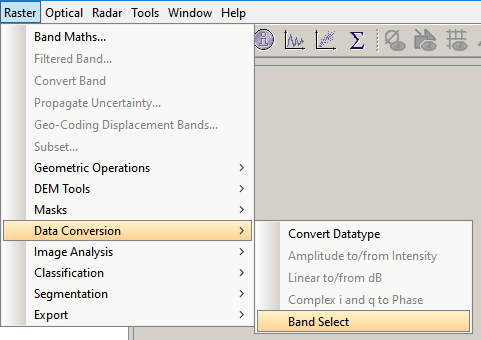
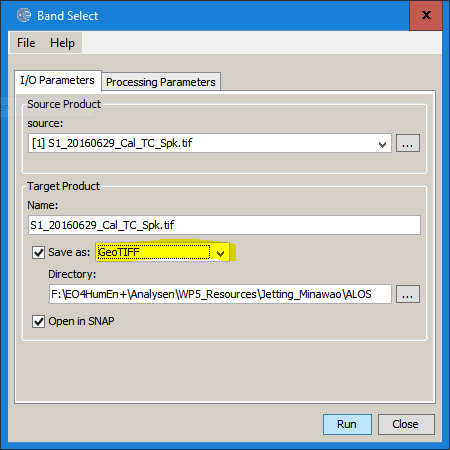
Yes I agree with you. I am aware of the different combinations of the bands as per the requirement, I was curious to know the corresponding polarization with respect to the spectral ranges (RGB) if it can be compared. I really appreciate for for your help so far. I am assuming that you are using updated version of SNAP wherein you get the Band Select option, the version I have doesn’t showing that option.
You can hit Help > Check For Updates to get the latest version of SNAP.
As SAR backscatter is based on physical parameters of surfaces (roughess, moisture, shape, size, orientation) SAR RGBs and optical RGBs cannot be compared directly. They rather provide information complementary to each other.
 And yes I think I have to go through the basics of SAR but since, I have to analyse this as per the scheduled project timeline thats why I am trying to push hard just to get the output asap. I am aware of the fact that without getting into it, it wont be easy for me. Thanks a lot for your help so far. One last confusion I have read somewhere about the RGB combinations which are as Red-VV, Green-VH and Blue-VH/VV and another one Red-HH, Green-VV and Blue-HV. Could you suggest which one is correct one??