Histogram - automatically calculated value for band math

Hi,
I extract water bodies from Sentinel 1 image based on this tutorial http://www.un-spider.org/advisory-support/recommended-practices/recommended-practice-flood-mapping/step-by-step . It works fine and I have done it manually but I have to do it automatically in near future. There is one step in the process workflow I do not know if it is possible - automatically choose tresshold value from histogram for band math.

Is there some process how to do that ? I would like to ask also if there is better workflow/tutorial with better results than mentioned.
Thanks.

You could try different values in different images and see which one produces better results. Then, use this value as default for automatic processing. Maybe you can use ratios or other sources (i.e. S2) to improve the threshold selection to create the water mask

You can use the StatisticsOp to determine a percentile threshold. The result is saved to an ascii file. Would that help you?

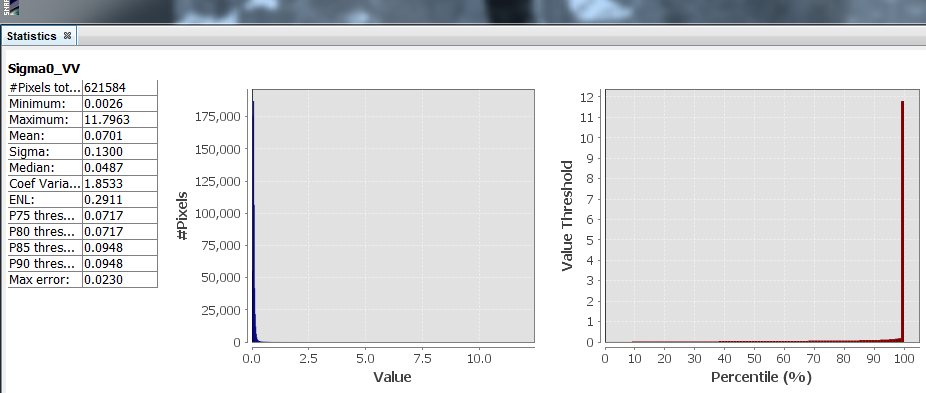
I have tried StatisticsOp but there is no value that is near tresshold.

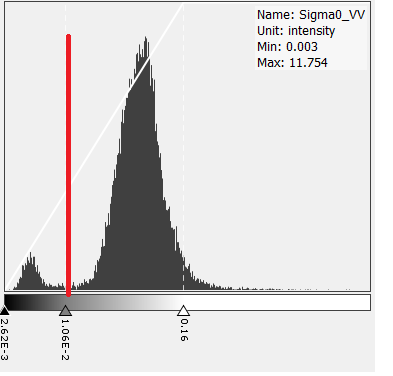
The value with the best result is aaproximately 0.01(1.06E-2 log) for this image. I do not know which value from stats I could use, it seems there is no value close to the best tresshold.

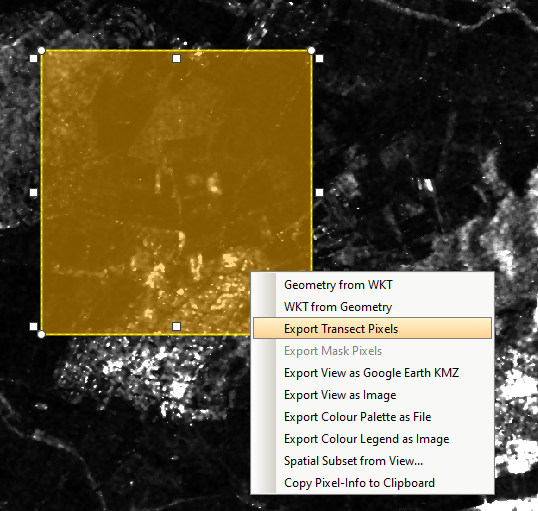
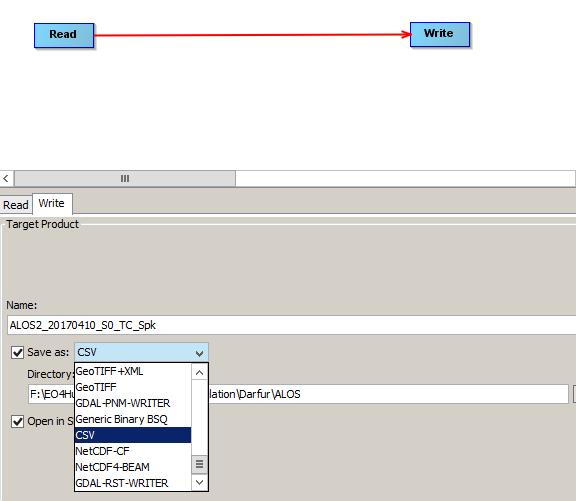
I don’t think this is possible in SNAP alone. You can try to export your raster values as a table (can be automated), then create a histogram out of it (https://docs.scipy.org/doc/numpy/reference/generated/numpy.histogram.html) and search for the local minimum in python. There are either functions to do this or you can transform the histogram into a function (regression curve) and search for local minima by yourself. If you want to do this automated a bit of programming is required, I guess.

2 Likes

Thank you for your answer, could you tell mi how to export raster values as a table ?

For testing:
Create a geometry and export a TXT by right-clicking:

For automatisation:
Export the whole product as a CSV

1 Like

Thank you, just for sure, result is supposed to be like this to use it for further proccesing (e.g. in numpy) ?

yes, you can read this structure in python (i would delete the first line so you just have the header) by defining tab as a delimiter.

https://docs.scipy.org/doc/numpy/reference/generated/numpy.loadtxt.html

1 Like

Hi, look up “Thresholding”, in particular “Jenks Natural Breaks”. I have used other softwares “Slice” tool in the past to reclassify bi-modal images. Not sure if available in STEP. I think there are Python scripts available.

1 Like

Hi kurrajong,
thanks for your response, could yout tell me what other softwares have you used ? I am interested in open-source mainly.

SNAP does not have Jenks Natural Breaks, but KMeans. If you perform clustering on only one band, the result should be similar.

was using Arcmap. QGIS might have the option.

Hello I’m interested to know if there is a tools in snap that can extract suit thresholding automatically for extracting water

Hello I want to know if jenks can make a suit threshold for binarisation of ndwi raster

Not sure what you mean … you can have a look at the Statistics Tool View and the Statistics Op if you want to find thresholds.

Hello where i fond statidtical tools for extraction suite threshold fit indwi image binarisation

It’s in Analysis->Statistics . After that you could use Raster->Band Maths to create a band from an expression using the threshold.

HELLO again but i have to get a suit threshold value automatically for ndwi raster in ordre to perform binarisation in two classe water and non water