Hello everybody! I am studying deformation analysis on SNAP. My topic is monitorıng of surface deformation with InSAR method. so, the analysis is related to interferometry. I’ll use Sentinel1B SLC datas. But, I don’know
generally, coregistration is the first step. But in case of Sentinel-1 data you better use the TOPS coregistration because it lets you chose the swath and also the number of bursts in order to only work on a smaller part of the large scene. Afterwards you create an interferogram and then you remove the stripes with TOPS Deburst.
I don’t know actually. Does the result of the Debursting look alright? Instead of Filtering you can also try Multi-Looking. It decreases your pixel resolution however.
Multilooking.
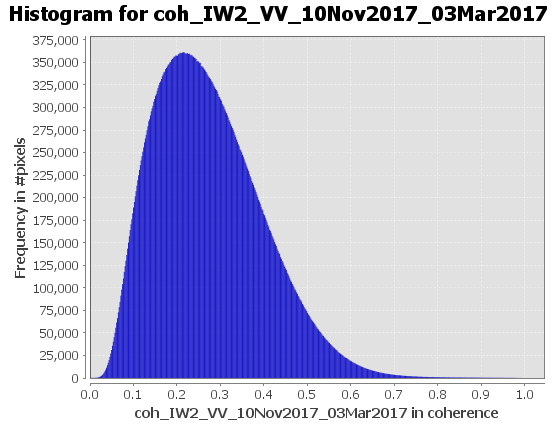
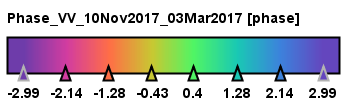
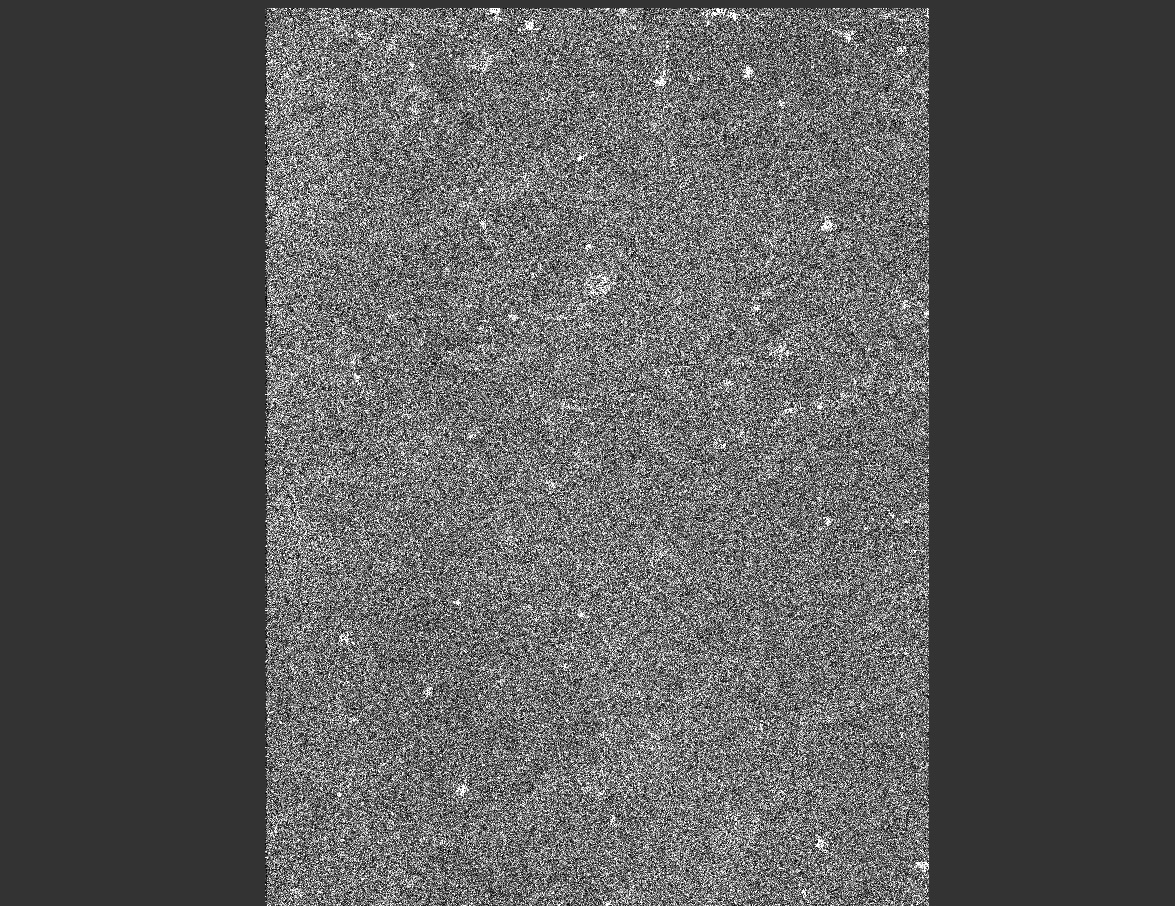
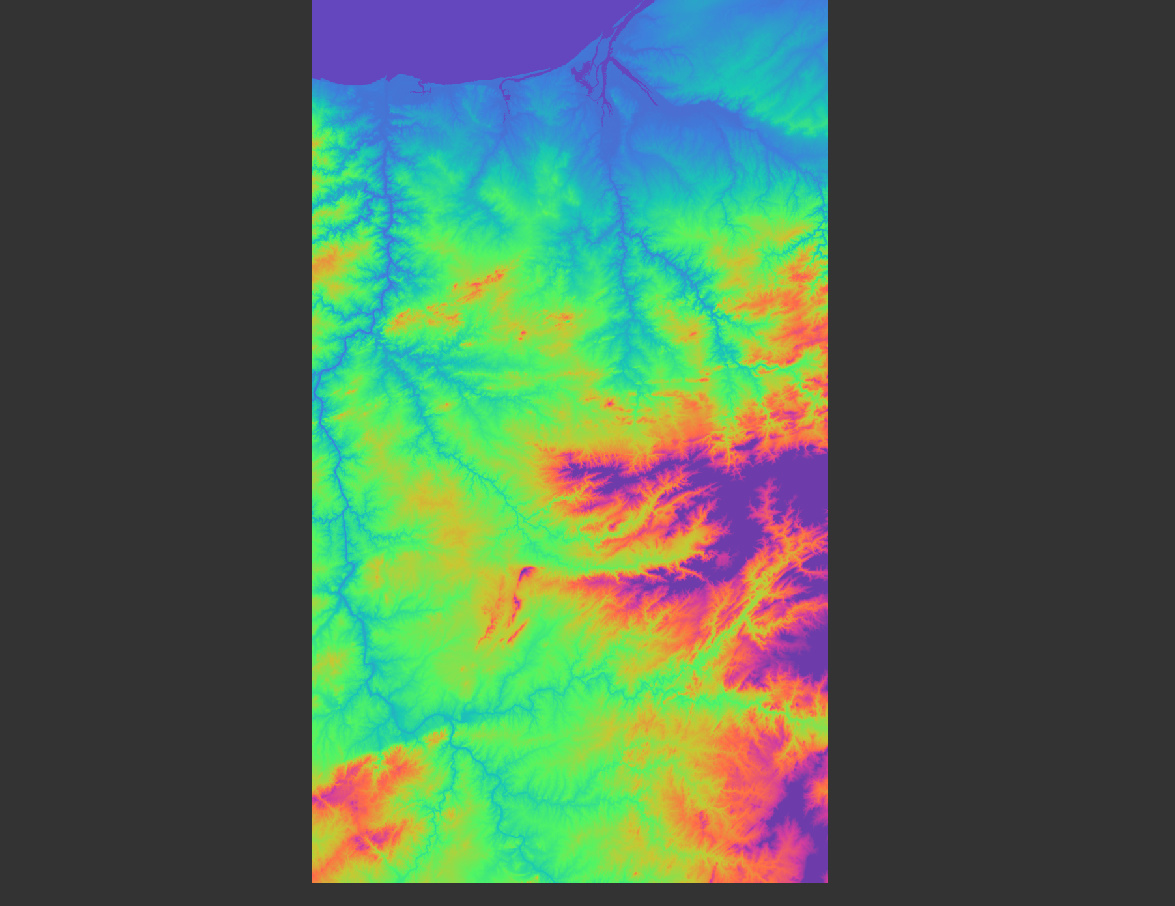
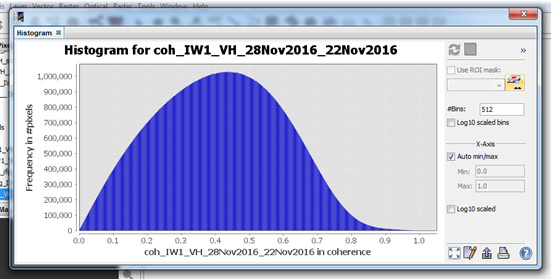
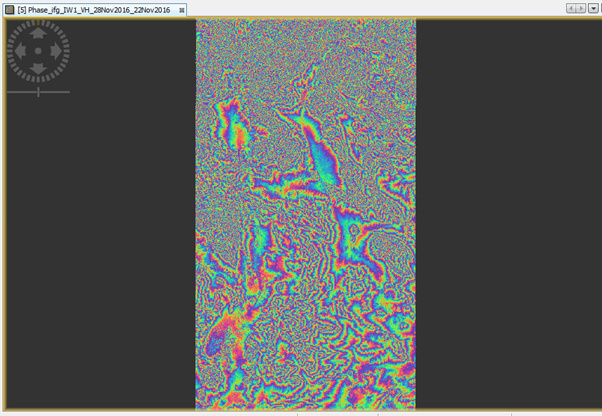
The interferograms, histogram and colour legend belong to proceses are above.
*But I don’t know how can I interpret these images?
*Is there anything else necessary to interpret?
*Where should I start?
I would be really glad if you help. Thanking you in advance. =)
These images belong to my friend’s work. How can I interpret ? I want to learn interferogram interpretation technique.
Please help in this regard.
Thank you. =)
please have a look at this topic where we discussed about the information content of interferograms. The coloured patterns you can see are also called fringes. In the mentioned topic you will find some explanations on fringes and external links to valuable resources.
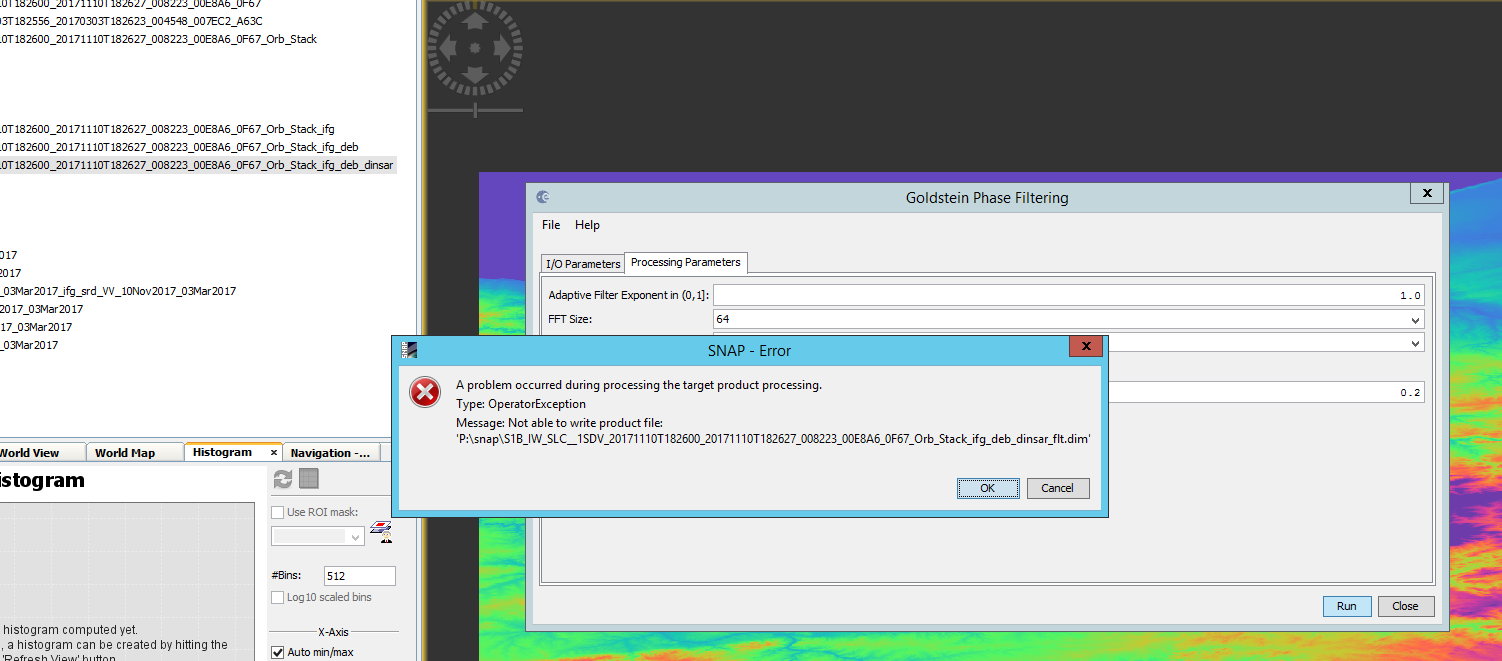
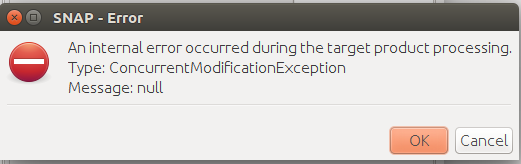
I follow the tutorial above . However , an error occurred at the end of the İnterferogram Formation :
What should I do in the face of this error? Thanking you in advance.
S1A_IW_SLC__1SSV_20160114T115038_20160114T115105_009490_00DC5A_3078.SAFE
S1A_IW_SLC__1SSV_20160207T115038_20160207T115105_009840_00E684_388D.SAFE
I use Sentinel Toolboxes 64bit version 5.0 (with Sentinel Toolboxes only) and SNAP 5.0 x64 with Ubuntu 16.04.
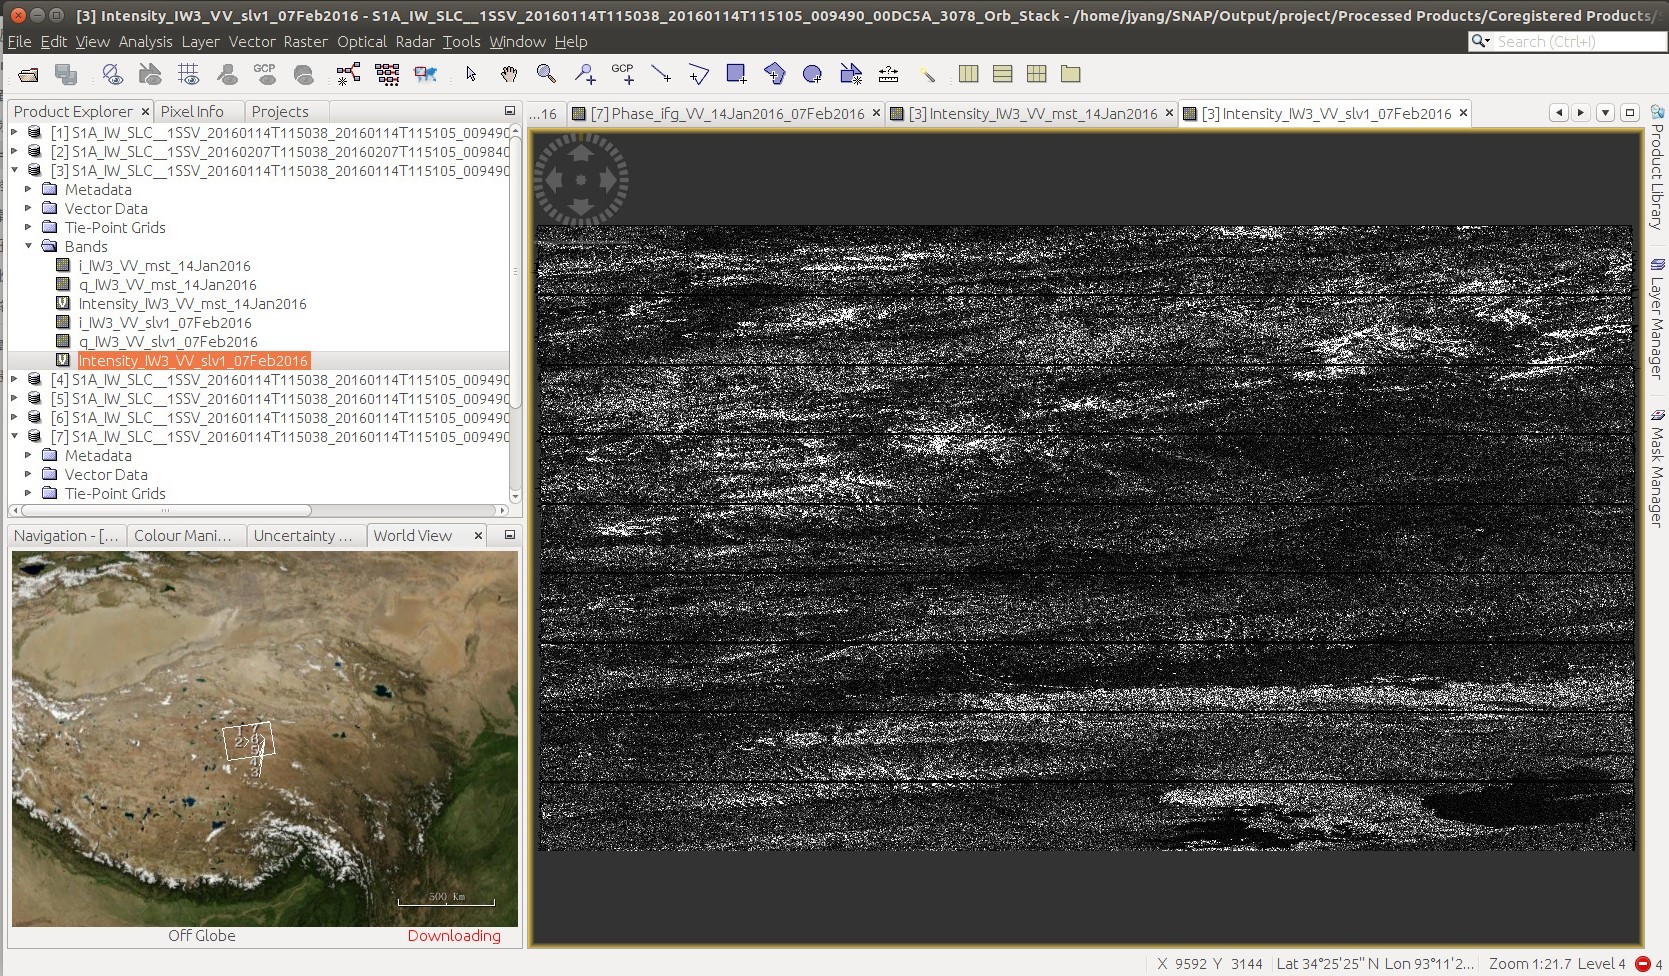
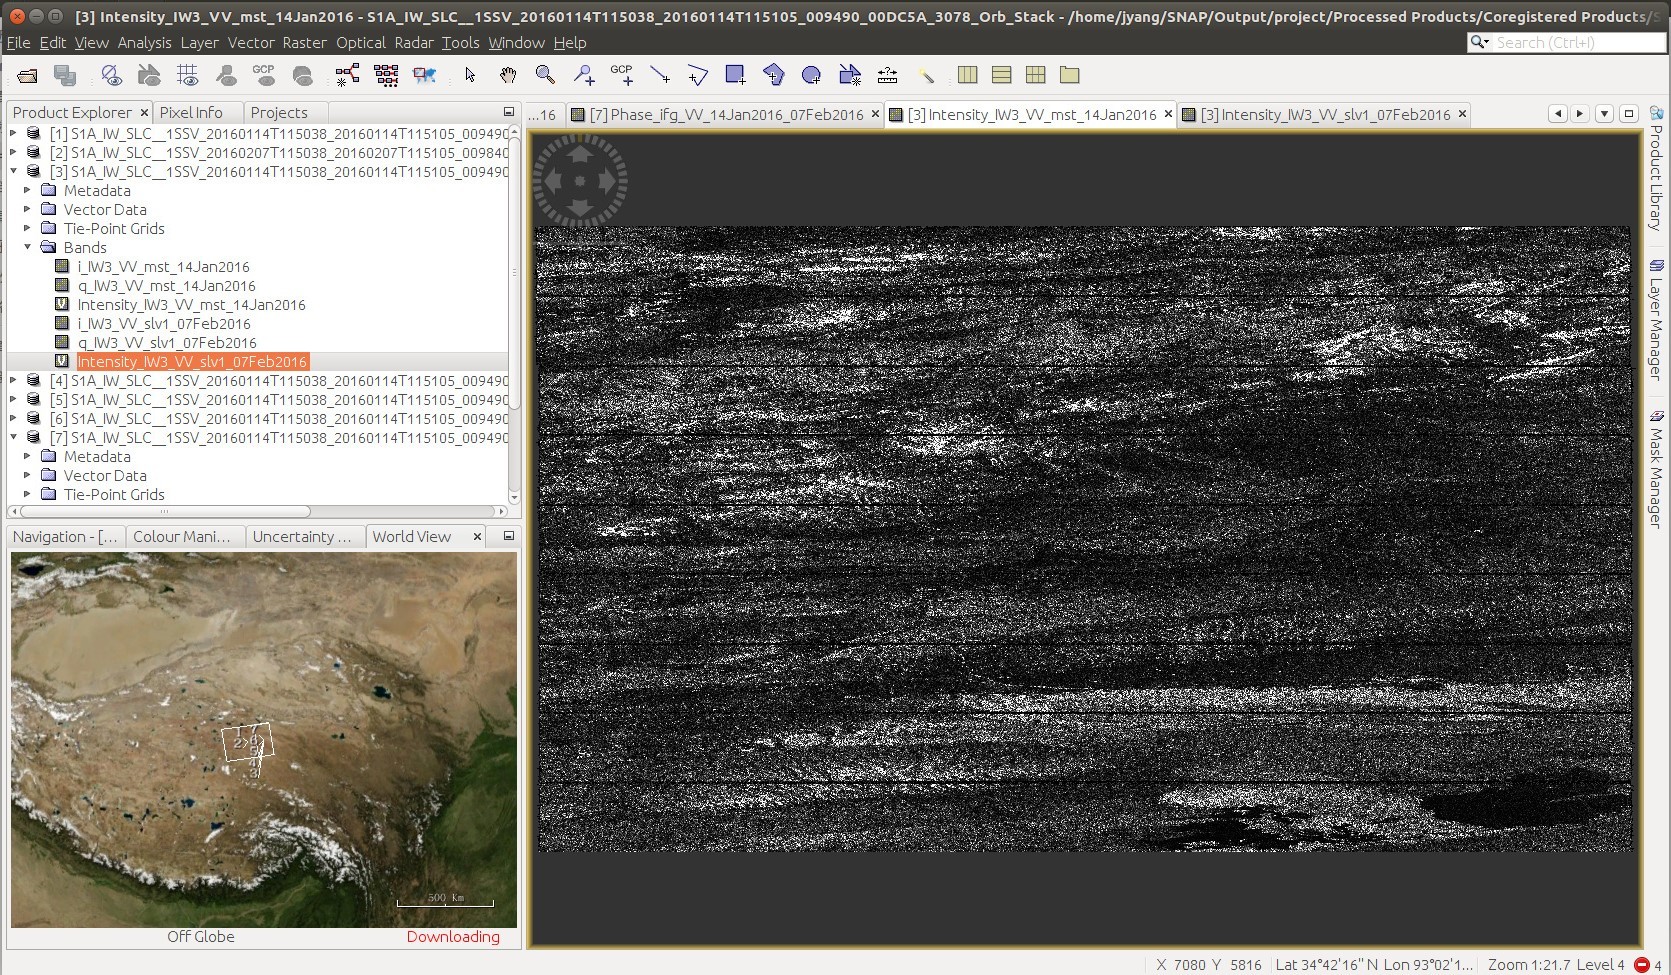
I follow the tutorial, the registration results are good:
two images overlap almost completely
can you maybe make an RGB image from both to see if they really align? You can do this by right click on the product and select “create RGB”. Choose the two Intensities for red and green.