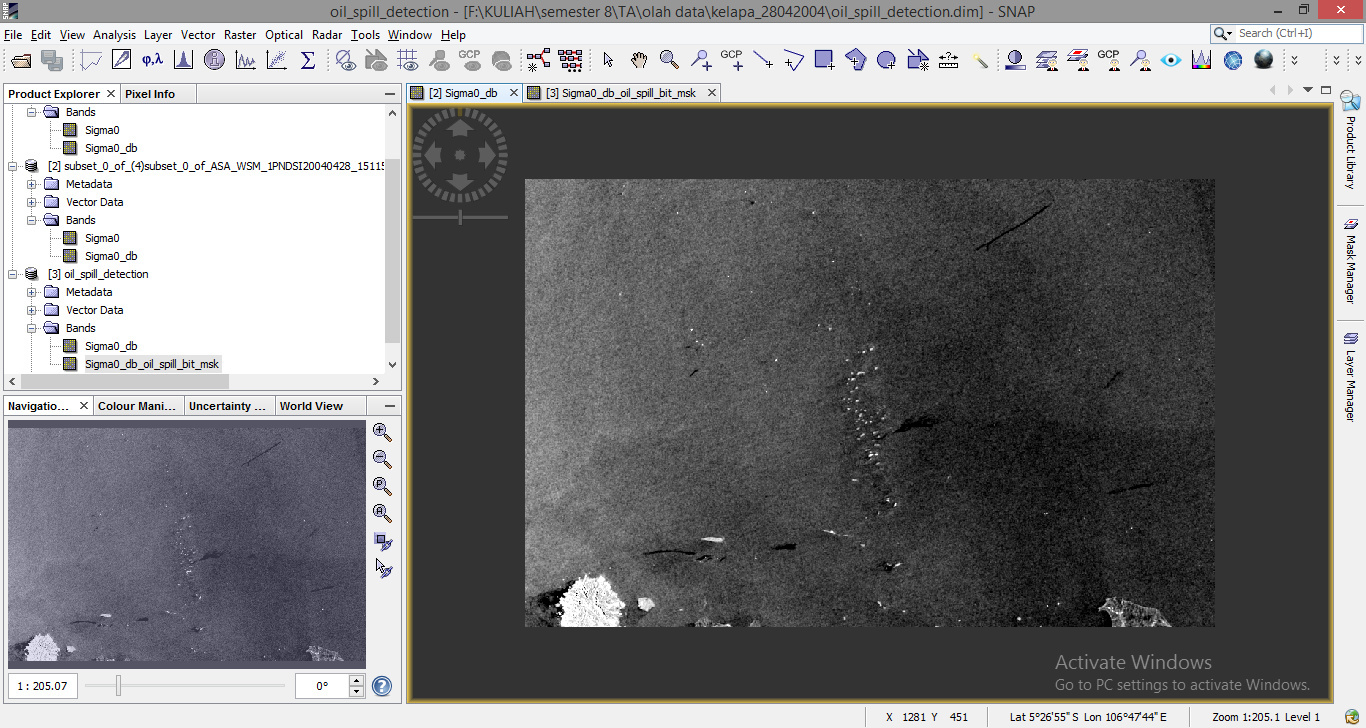
I’ve tried experimenting with the background window size in the oil detection and the threshold shift - ive also changed the minimum oil cluster size. For example here using the smaller ENVISAT file i have:
Could anyone add a screenshot of what a successful output should look like? I have had a look at the paper used to design the algorithm “Algorithms for oil spill detection in Radarsat and ENVISAT SAR images” and the dark spot detection is alot more solid as expected. My output looks almost inverted? The spills were very extensive and easy to spot in the image.
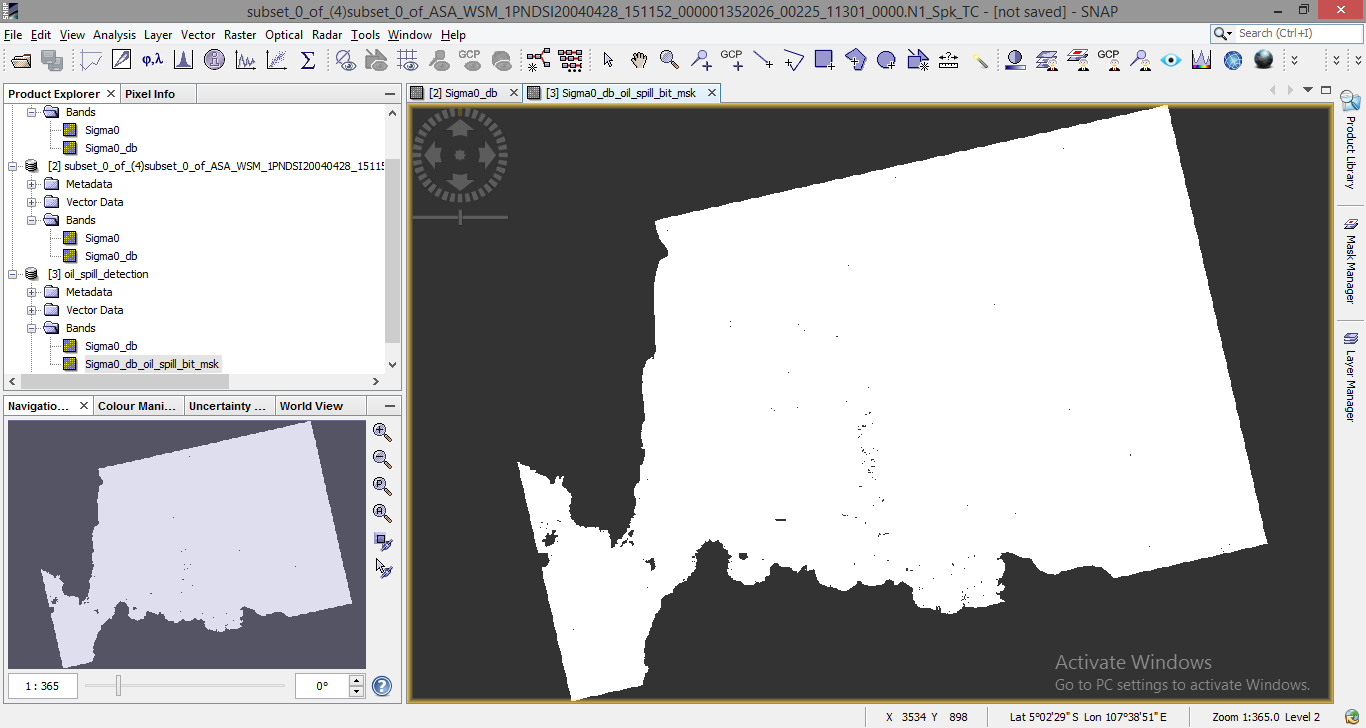
I tried the very large 512 window and the results look better, I also increased the min clustering size. It runs on the graph now as well. Thanks for the help.
Is there a recommended Background Window Size and Threshold Shift in dB? I’ve been reading around and oil spills can dampen the sea anywhere from 0.6dB to 13.0dB. The default in SNAP is 2.0dB
Im interested too about oill spills and im going to use SNAP…I will try the settings as you, but have you discovered something? I will make some tests!
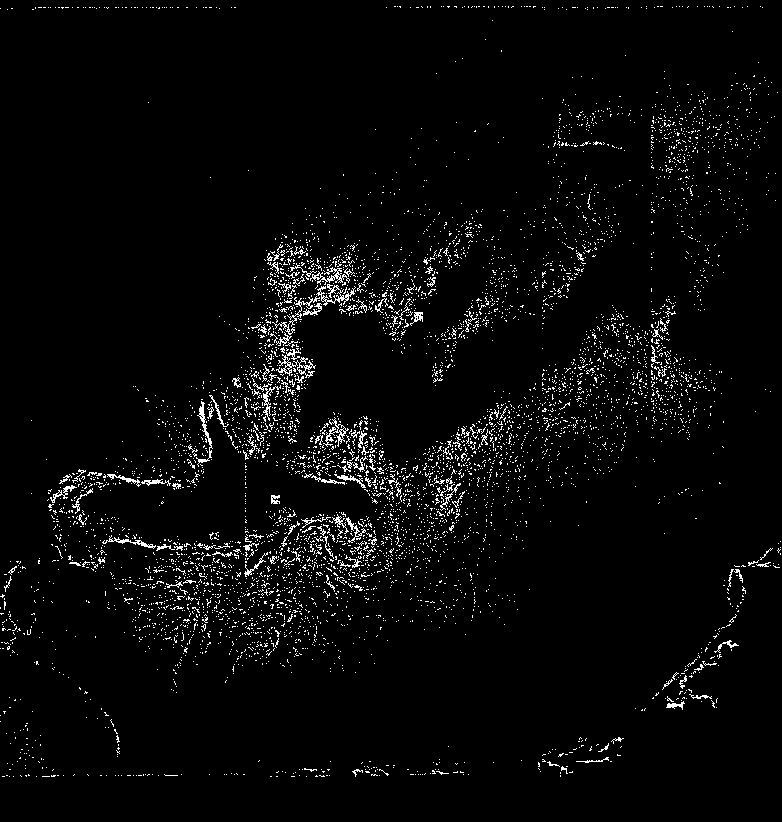
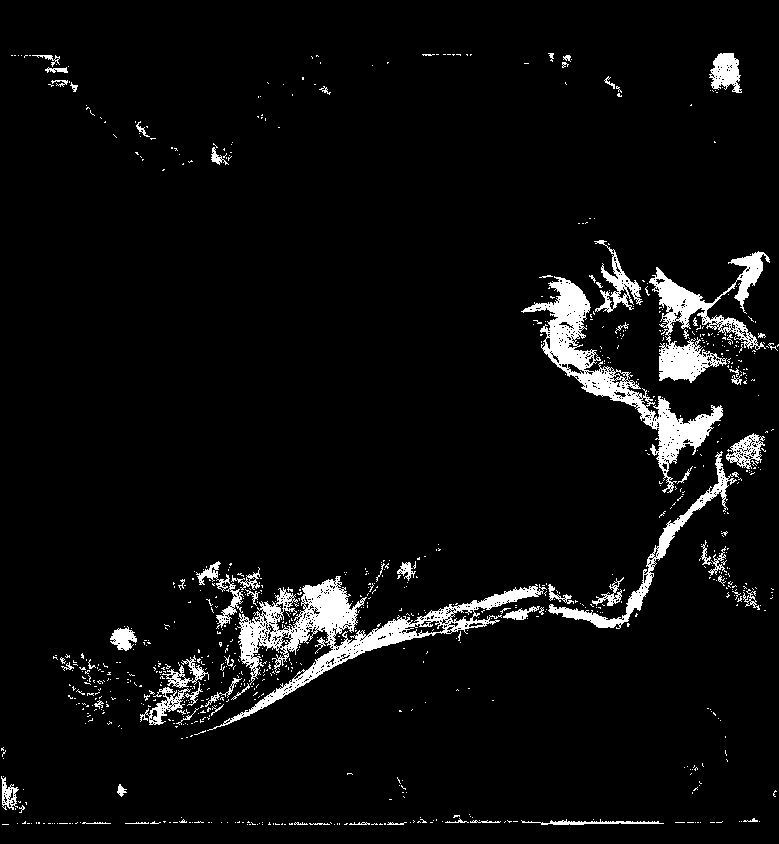
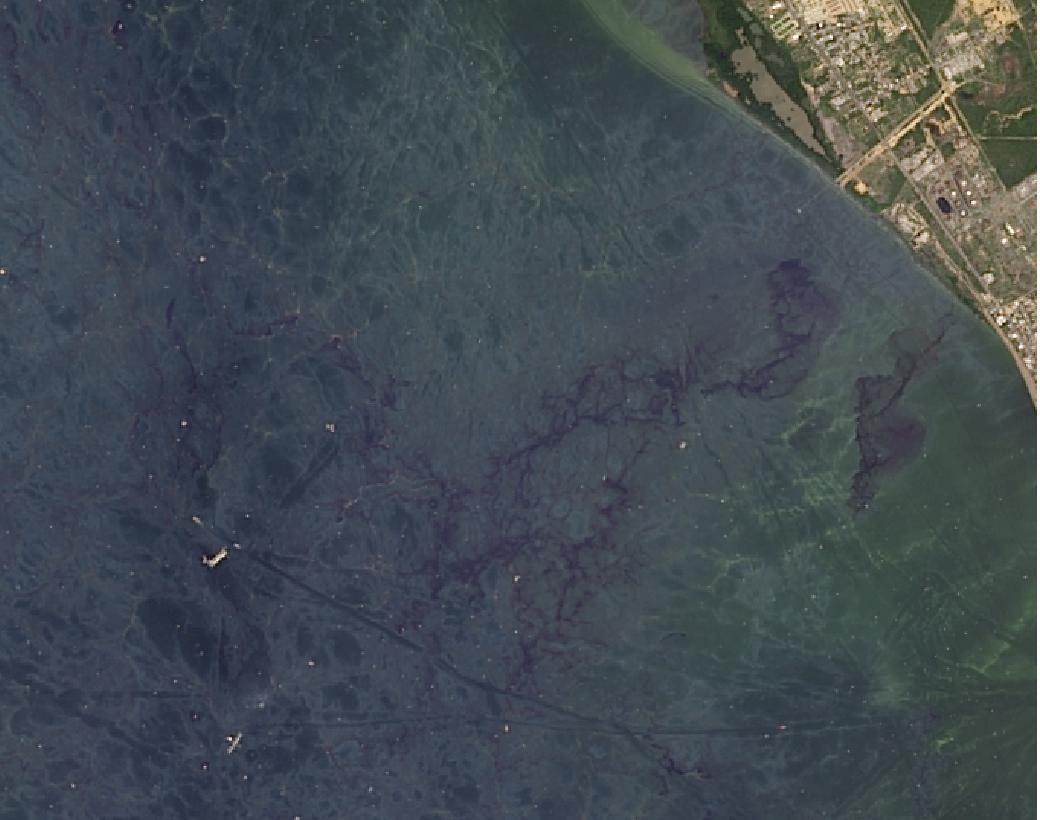
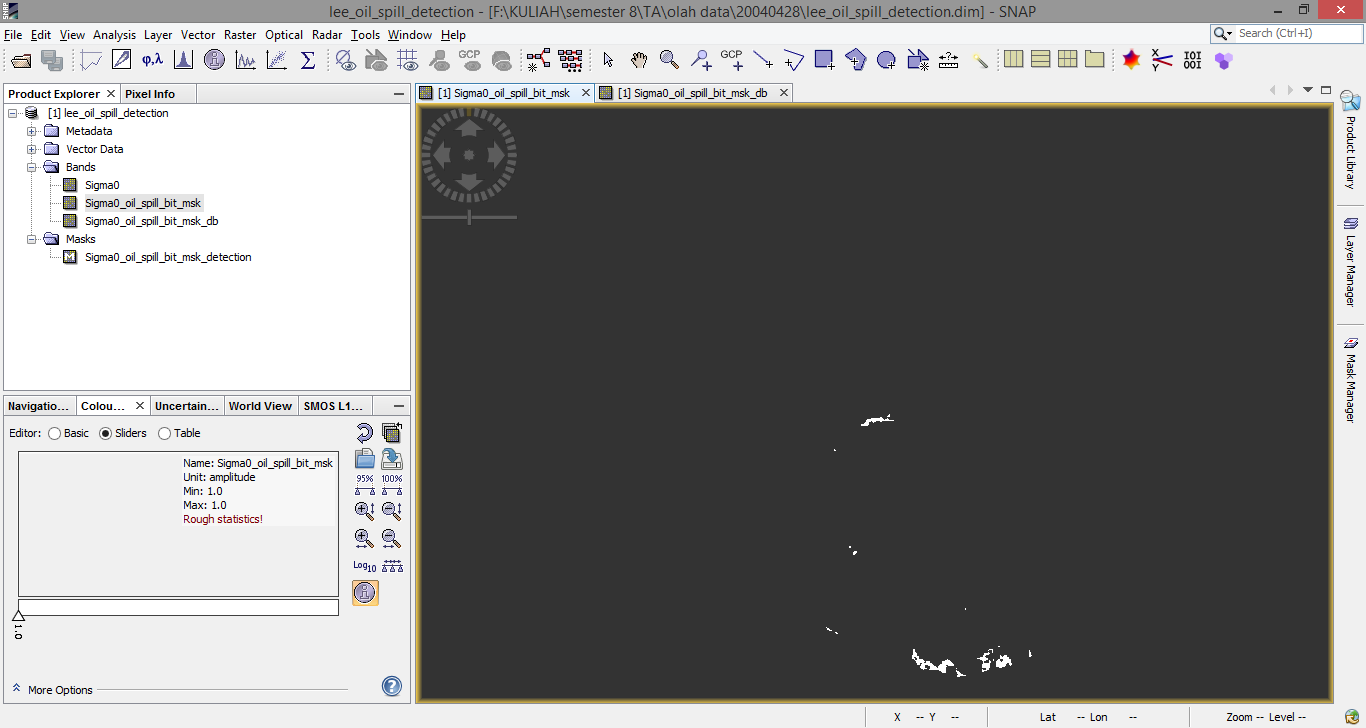
I am working with Sentinel1 SAR Data in order to detect oil slicks in Lake Maracaibo, an area with frequent and massive oil spills easily visible with optical sensors like Pan-sharpened Landsat8 Natural Color. In rainy season, this task is not so easy due to cloud coverage so this is my main reason to use SAR Data. I am using SNAP 4.0.0 tool to calibrate an VV Image and then using Sigma to detect oil spills in the SNAP MENU: Radar, SAR Applications, Ocean Applications, Oil Spill Detection but the result is not even near to the reality. Any help is welcome. Also I have some questions,
I am observing some spots very similar to clouds over water. Is this possible with Sentinel1 SAR Data? Could be phytoplankton?
Could you provide the input product names and spill area you’ve detected by other means?
The detector is not automatic for any scene. You may need to adjust the background window size and threshold.
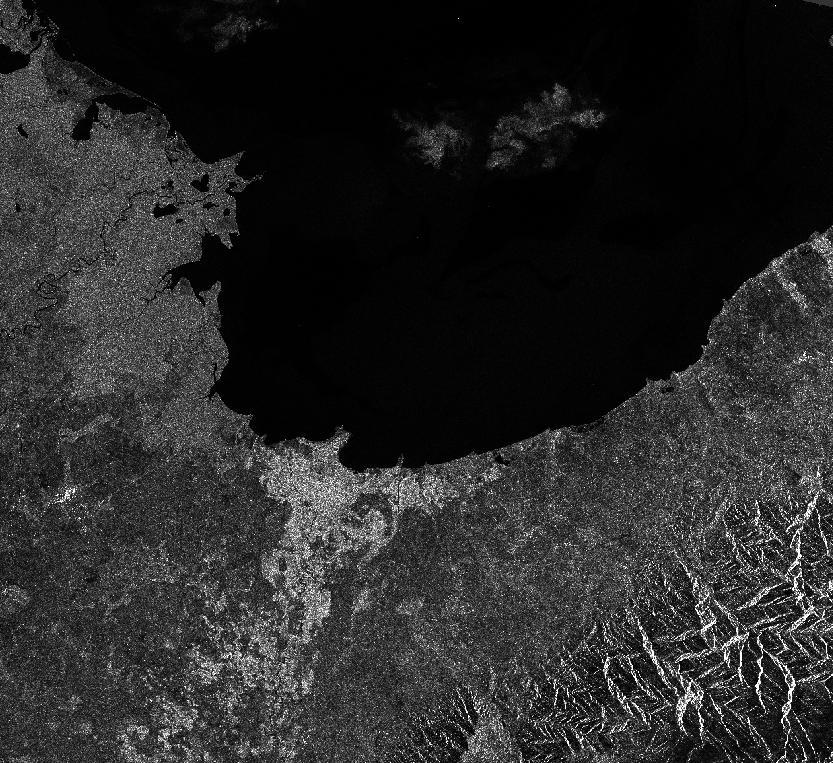
The detector looks for dark areas in the image where the capillary waves have been suppressed compared to the surrounding area. If the oil emulsifies the area will appear lighter. Generally bright areas over water means that it is rougher.
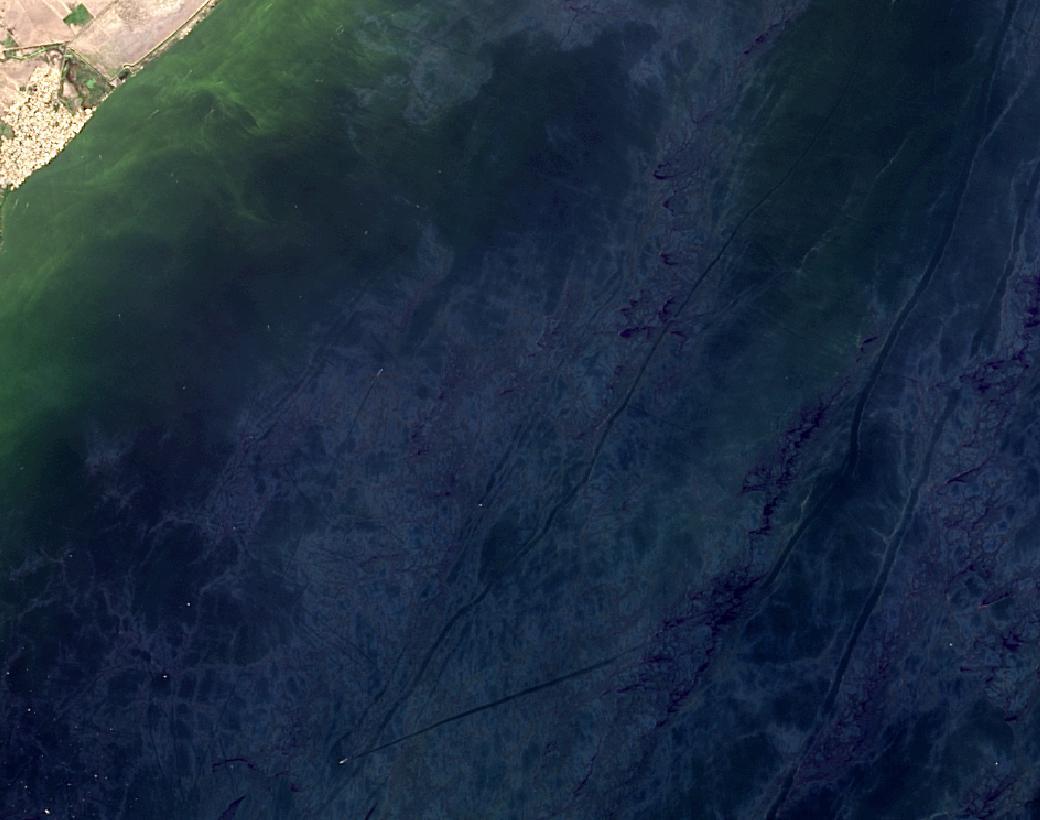
Two subsets of Landsat 8 scene LC80070532015301LGN00 pan sharpened previously are attached. These areas show oil slicks almost permanently. The Sentinel1 scene tested was S1A_IW_GRDH_1SSV_20160924T103259_20160924T103324_013193_014FC3_CD7E .
Thanks a lot in advance.landsat8-1.jpgw (106 Bytes) landsat8-2.jpgw (103 Bytes)
i want to ask about Background Window Size and Threshold Shift. i have problem with it. Could i change the value, because the default in SNAP is 2.0dB. thankyou
‘default’ means that it works for most cases but can (or should) be adjusted according to your data.
As stated in the help:
1. First the local mean backscatter level is estimated using pixels in a large window.This is your background window. 2. Then the detecting threshold is set k decibel below the estimated local mean backscatter level. Pixels within the window with values lower than the threshold are detected as dark spot. k is a user selected parameter (see parameter Threshold Shift below). 3. Shift the window to next window position and repeat step 1 and 2.
For dark spot detection, the following parameters are used (see figure 1): Source Bands: All bands of the source product. Background Window Size: The window size in pixels for computing local mean backscatter level. Threshold Shift (dB): The detecting threshold is lower than the local mean backscatter level by this amount.
So it’s basically about the relation of backscatter intensities between the oil slick and the ocean surface. You can draw a profile line along the oil slick in order to investigate the change in backscatter at the transition from oil to water. This helps you defining the threshold. The windows size is rather connected to the scale of your image, like the relation of the pixel size to the size of the oil slick. As you saw above, a size of 512 led to better results for con20ors data.
Have a look at the Brekke and Solberg (2005) paper - slicks can dampen the water anywhere from 0.6dB to 13.0dB, natural seeps are similar.
Finding the right threshold will depend on content, age, weather conditions - it really is a complex issue. What we find is we need weather data and then increase or decrease the threshold accordingly. If the wind speed is too low (i.e. calm), everything will look like a slick, too high (a gale) nothing will look like a slick.
i want to ask, if i have finished detect oil spill, what will i do to classification the oil spill, so i can get real oil spill not look alike. thankyou
It’s difficult to do. You may need to look at the sea state by using wind data possibly from the S1 OCN level-2 products.
Low wind areas may appear similar.