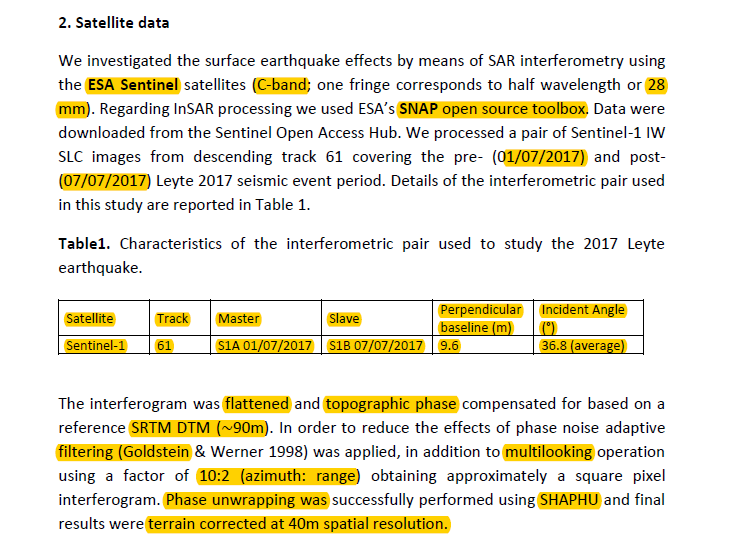
Hi all. I have processed an image pair using the S1TBX TOPSAR Interferometry tutorial and I am quite happy with the results (there seems to be a clear signal) however I was wondering if there are any additional steps not listed in the tutorial that could improve the interferogram further? For instance, would any of the following steps improve coherence? :
you could, theoretically, use more image pairs of the same region, process like above and then create an average interferogram out of all. This clearly reduces the influence of atmosphere on interferometric phase.
This however requires that your surface didn’t change much between the image pairs’ acquisitions.
Sorry I don’t think I fully understand this. What would be the utility of the average interferogram? Would the interferometric image pairs used in the averaging have to cover more or less the same period?
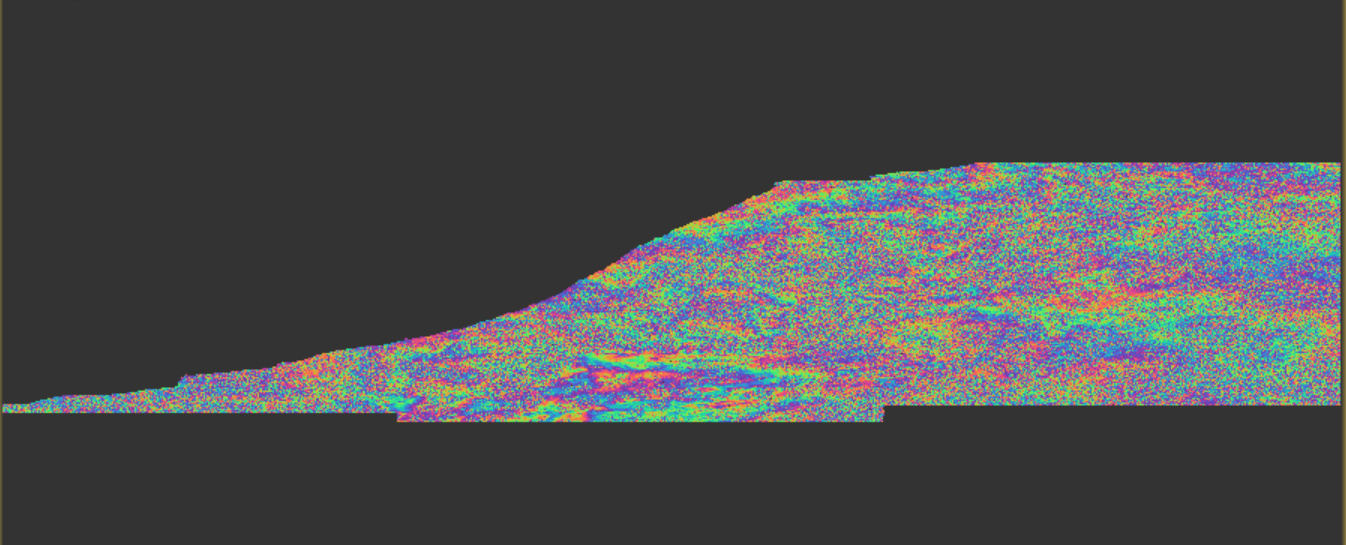
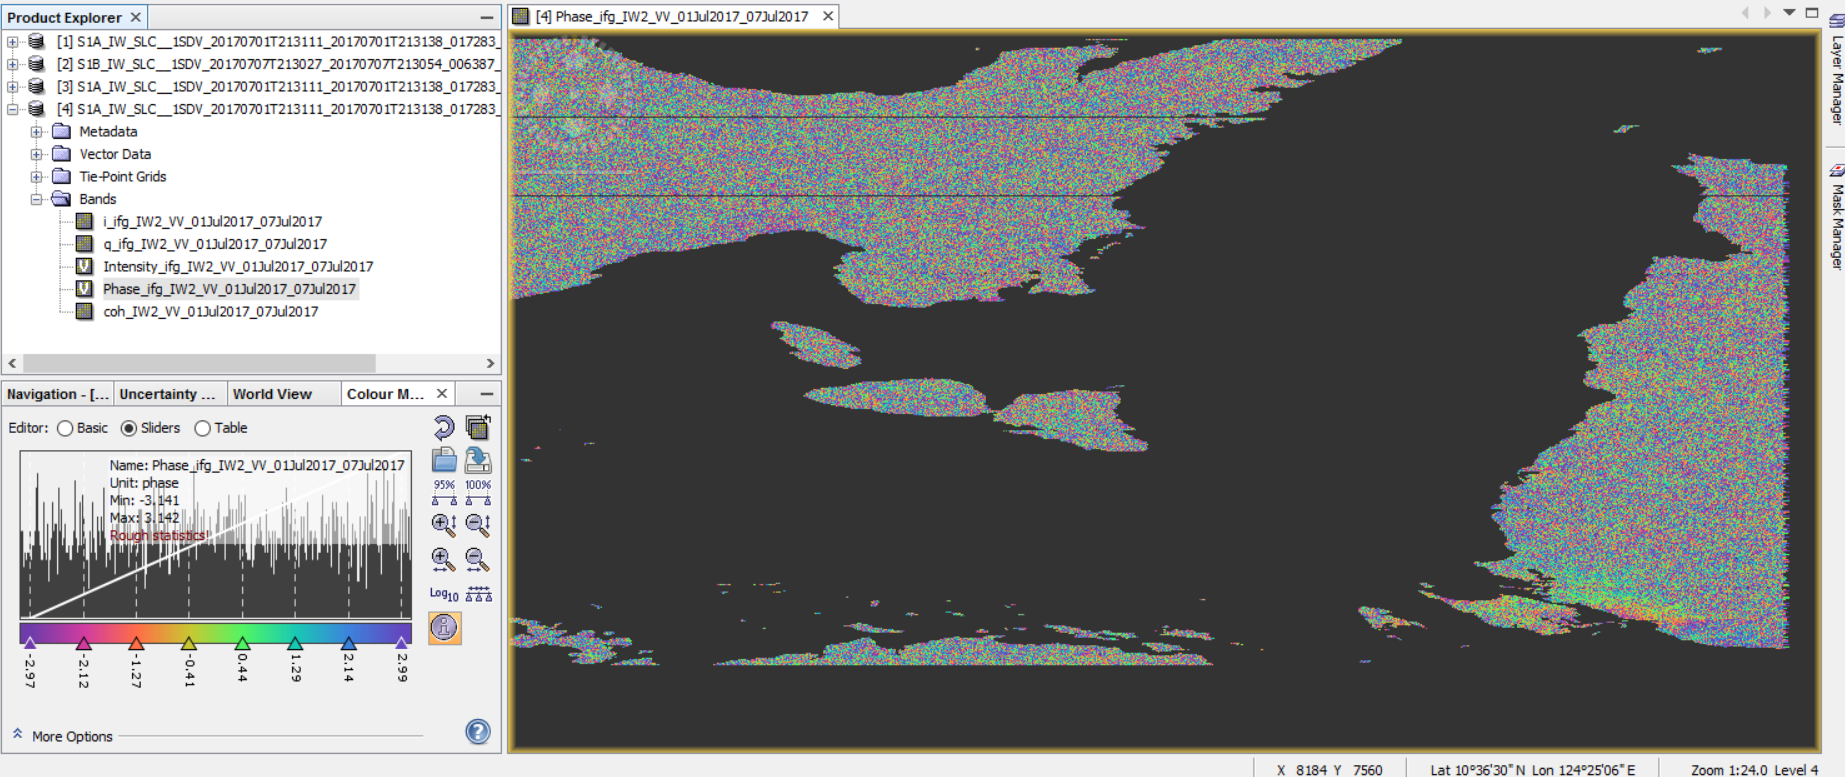
My interferogram does not seem to show visible “fringes” so even though i proceed with topo phase removal and goldstein filtering it seems something is not right from the interferogram formation
Can someone tell me what is wrong? is it with the parameters i used? i just use the same in the tutorial
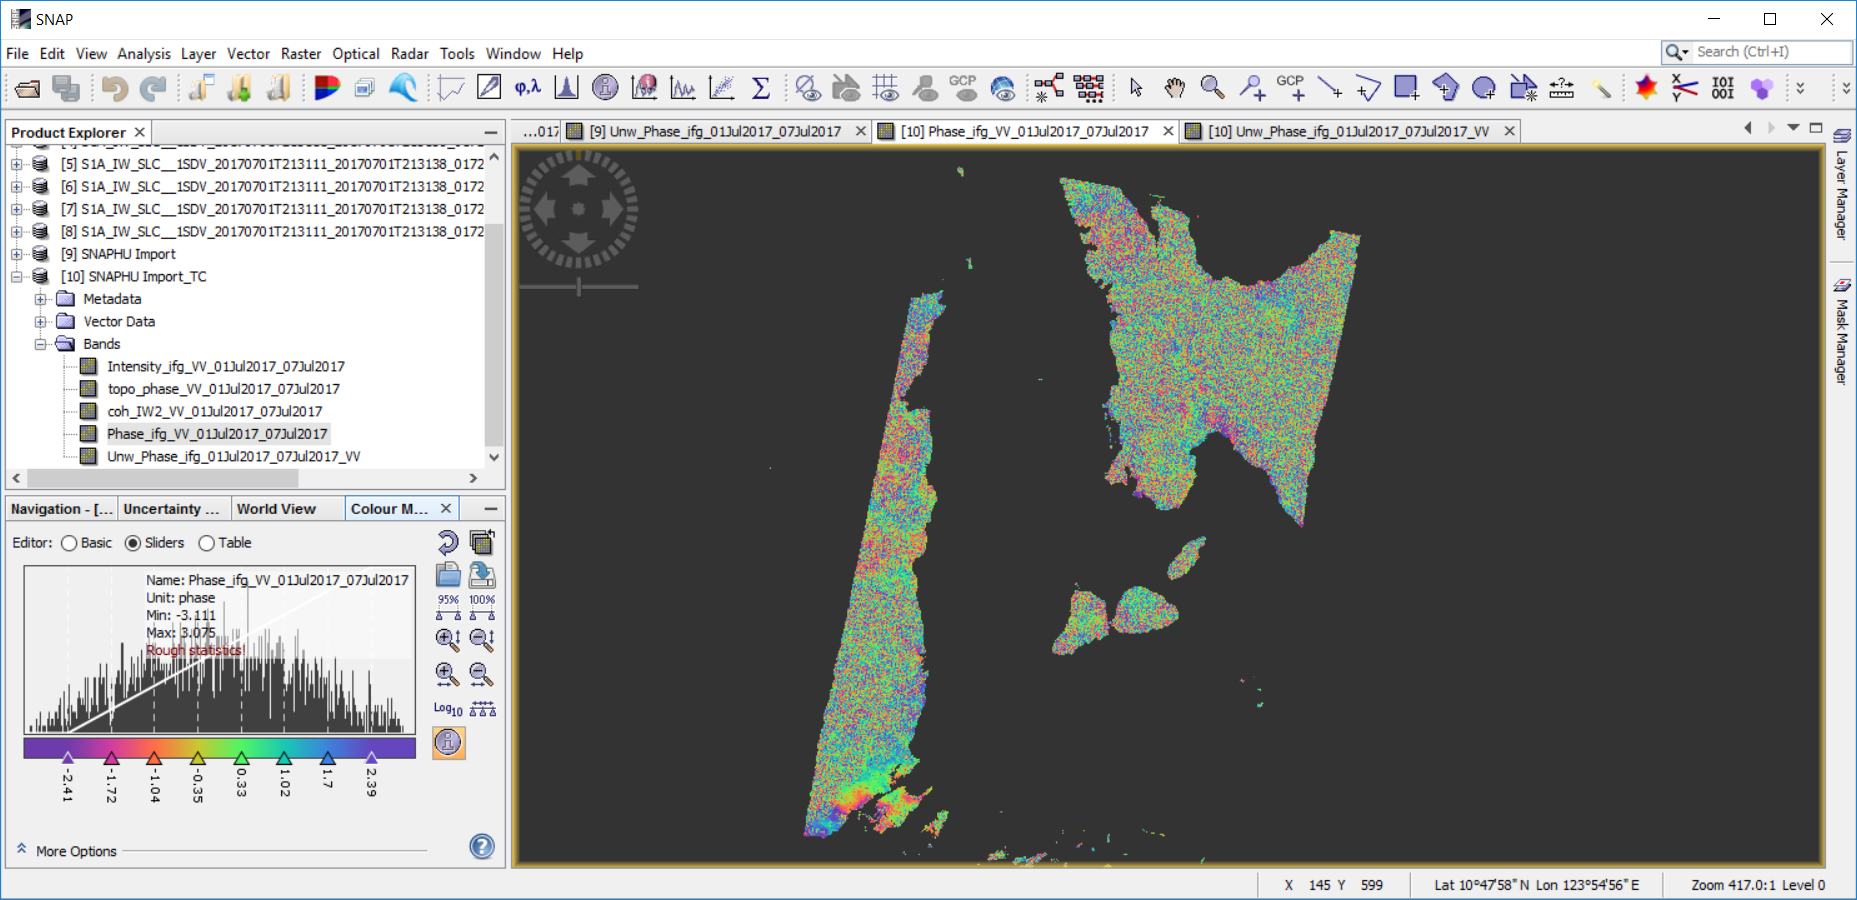
I still proceeded with the topographic phase removal ->goldstein filtering -> multilooking -> phase unwrapping using SNAPHU then Terrain Correction and the result was:
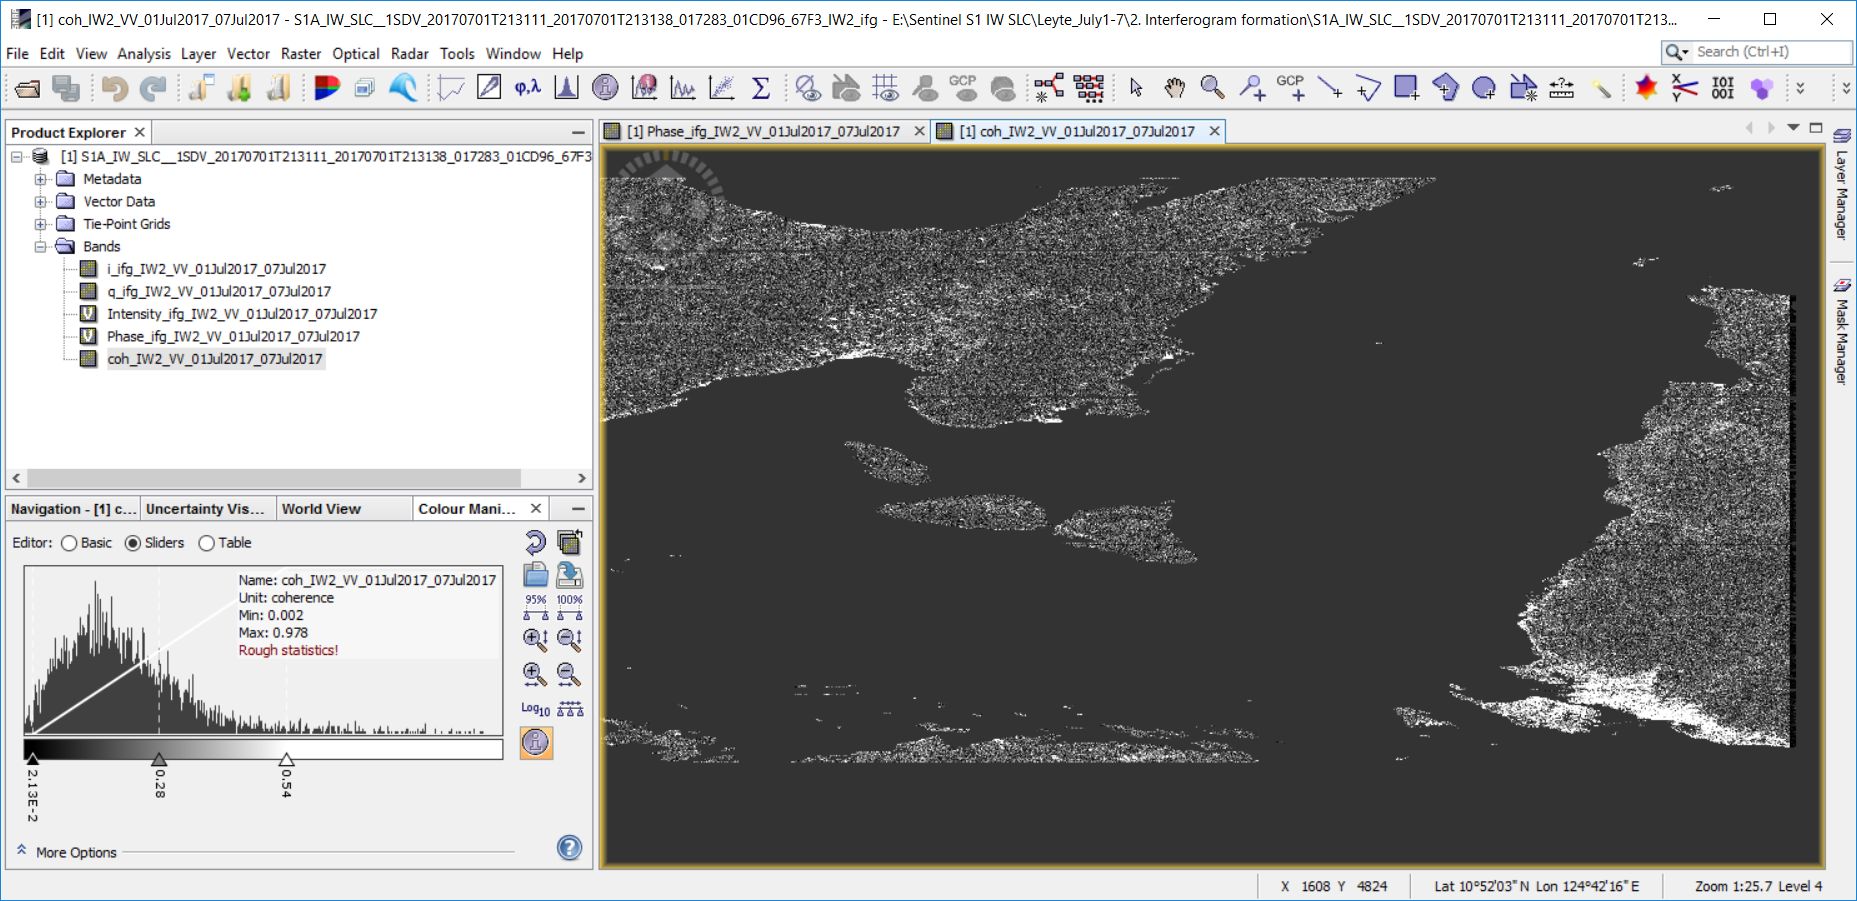
As ABraun said mentioned, if your coherence is low, no fringes are formed, hence, you have just random phase. By looking at your SAR image, it looks like the coherence is low apart from a few areas in your image. The quality of the interferogram is heavily depends on the coherence.
I guess that what you are trying to do is to estimate movement/subsidence on the ground ? if yes, then areas with random phase (low coherence areas) cannot be used for estimating movement or subsidence. You may need to look at your coherence map.
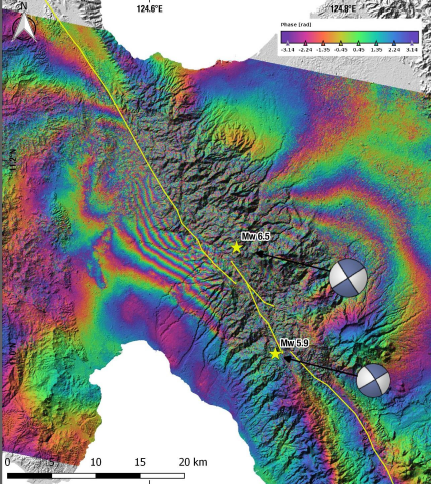
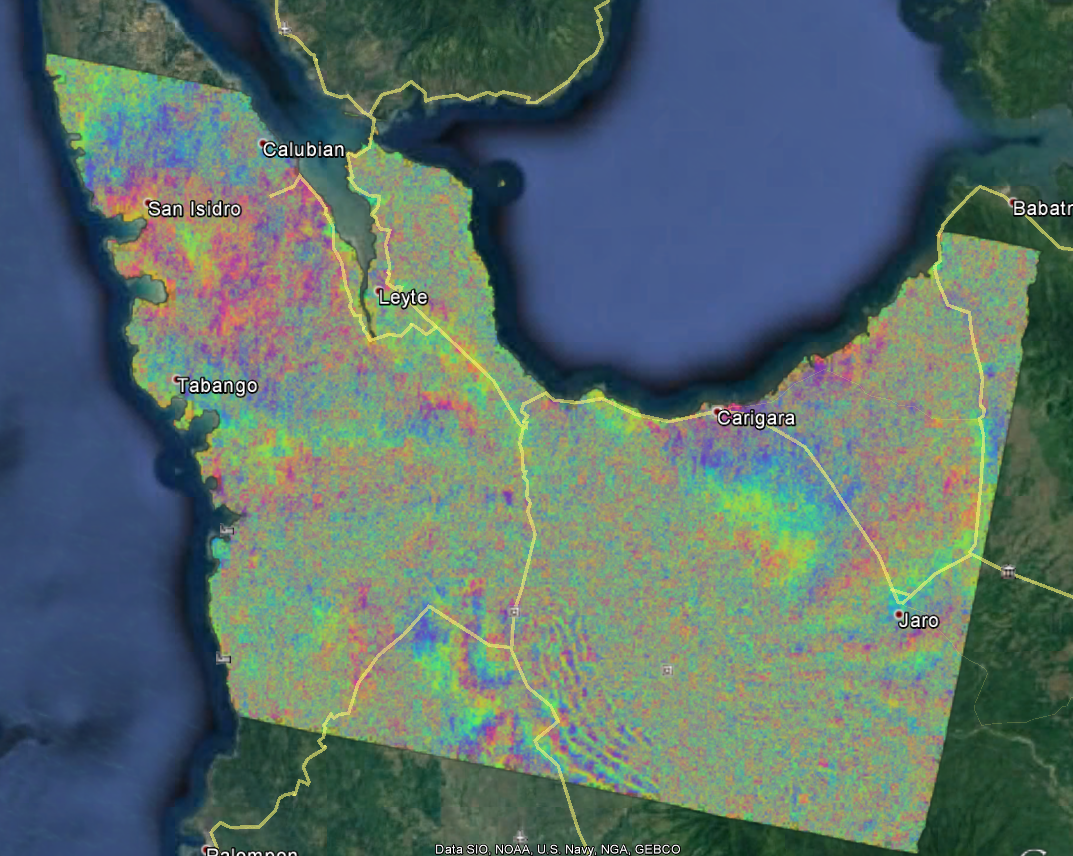
In terms of the second image, it looks like the coherence is high, hence, the nice fringes.
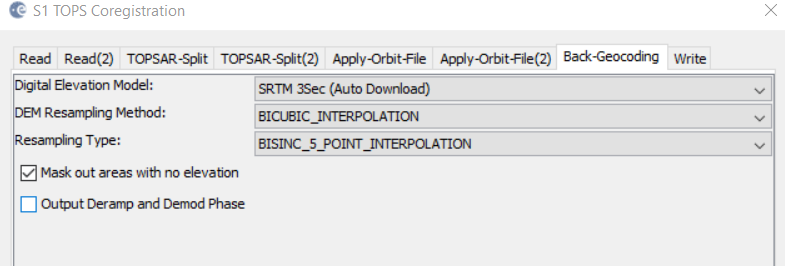
I think coregistration also plays a major role in the resulting quality of the interferogram. Besides that, Multi-looking, filtering or the quality of the DEM could have differed in the cited study which all increase or decrease quality of your fringes.
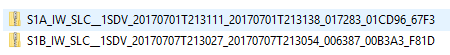
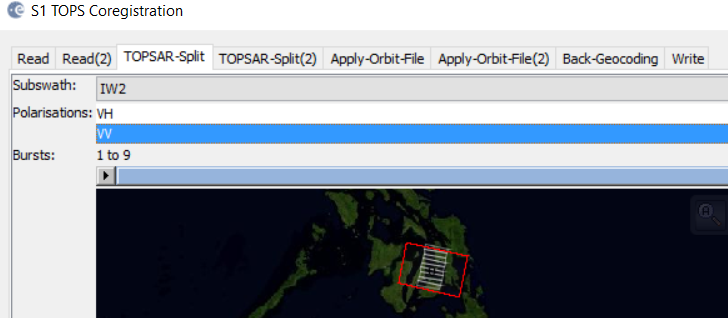
@mauleon.fb I can’t imagine the coherence being that bad with just 6 days between passes. Did you use the same subswaths in each scene? Do they sit on top of each other well, or is one subswath different from the other? Did you use S1 TOPS Coregistration? Did you check the modeled coherence after coregistration? (Radar > Interferometric > InSAR Stack Ov erview) Add your files and run the overview. The modeled coherence should be as close to 1 (or 100%) as possible.
Are you sure that the interferogram you are trying to replicate was processed using the same exact datasets? Was ESA SNAP used for this?
Yes, highly recommend reaching out to the authors directly to see where you are falling short. I am eager to see what was done to accomplish the results shown in the paper.