Atmospheric Correction for InSAR

My problem is that I cannot find the get_modis.py file inside Train installation folder nor inside the entire linux system, in order to edit the APS_CONFIG.sh directories. I have cloned Train from github but still didn’t find any path named “TRAIN/python_packages/oscar-client-
python/get_modis.py”.


Is there a solution for this ?

There is an obsolete get_modis.py script, but NASA now requires an EOSDIS login to download MODIS data. For ways to download data, see EOSDIS Data Recipes.

Is this what referred to as Master Atmosphere in the tutorials ? which is plotted via (ps_plot(‘m’)

If I understand this correctly, the APS of the master interferogram is calculated accurately while the APS of slaves interfergrams are roughly estimated. Isn’t it? but why ? please could elaborate this slave APS issue or at least mention the research paper where this dilemma was discussed ? I didn’t find information about the term “Master Atmosphere” in [D.P.S. Bekaert et. al, 2015)

I am not sure as I have not used TRAIN for many years, but I see that the script you are trying to use is called “oscar-client-python/get_modis.py”. I suspect that this script was developed to use the JPL OSCAR service that was discontinued about four years ago. The OSCAR service was providing post-processed products for water vapor delay estimates from the standard NASA MODIS products, but it was developed about 10 years ago as a prototype service and it was not maintained after the NASA support for OSCAR ended.

Maybe the TRAIN script is getting the original NASA MODIS products and doing the water vapor delay calculation, using the same calculations that the OSCAR system used to do.

The MODIS Terra data was acquired at about 10:30 AM local time, which was close to the times of Envisat and ERS SAR acquisitions, usually within an hour of the same time. MODIS Terra (10 AM+10 PM) and MODIS Aqua (2 PM+2 AM) are much less useful for Sentinel-1 because Sentinel-1 is in a 6 AM and 6 PM orbit, so the MODIS acquisitions are about 4 hours away from the Sentinel-1 times.

1 Like

Then all my attempts went in vain since displacement velocity map estimation were built upon unwrapped interferograms with calculated troposphere contribution using TRAIN where that obsolete get_modis.py script was called. I have edited the APS_CONFIG.sh accordingly. I don’t know of other methods how to configure TRAIN to utilize up-to-date atmospheric data that is suitable for STAMPS processing of Sentinel 1 time series.

If somebody has a proper configuration for the APS_CONFIG.sh file that contains reliable scripts for PS InSAR Stamps processing of Sentinel-1 database, please send a Screenshot to it.

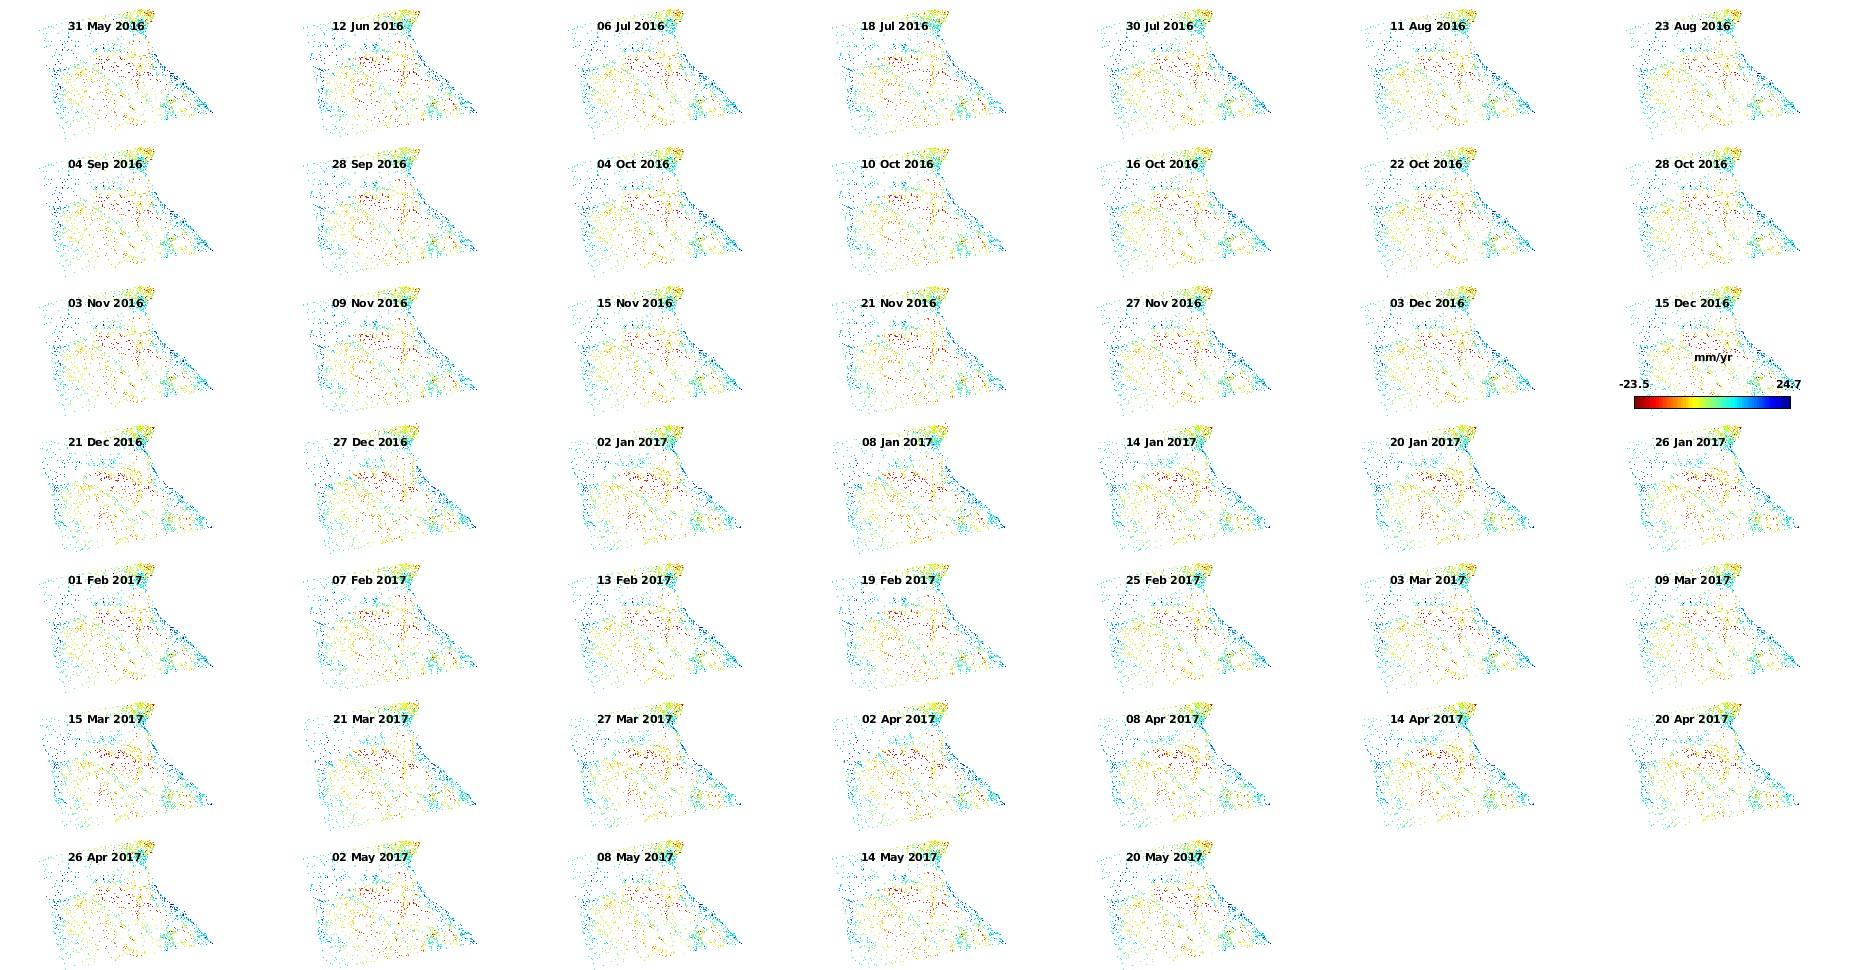
This is how the velocity map look like "ps_plot (‘vdrop-do’) look like. I see that it’s barely ever changing when dropping an interferogram at a time.

and Those are (‘v’) top figure , (‘v-do’) middle figure and (‘v-dao’) bottom figure after stamps(7,7)


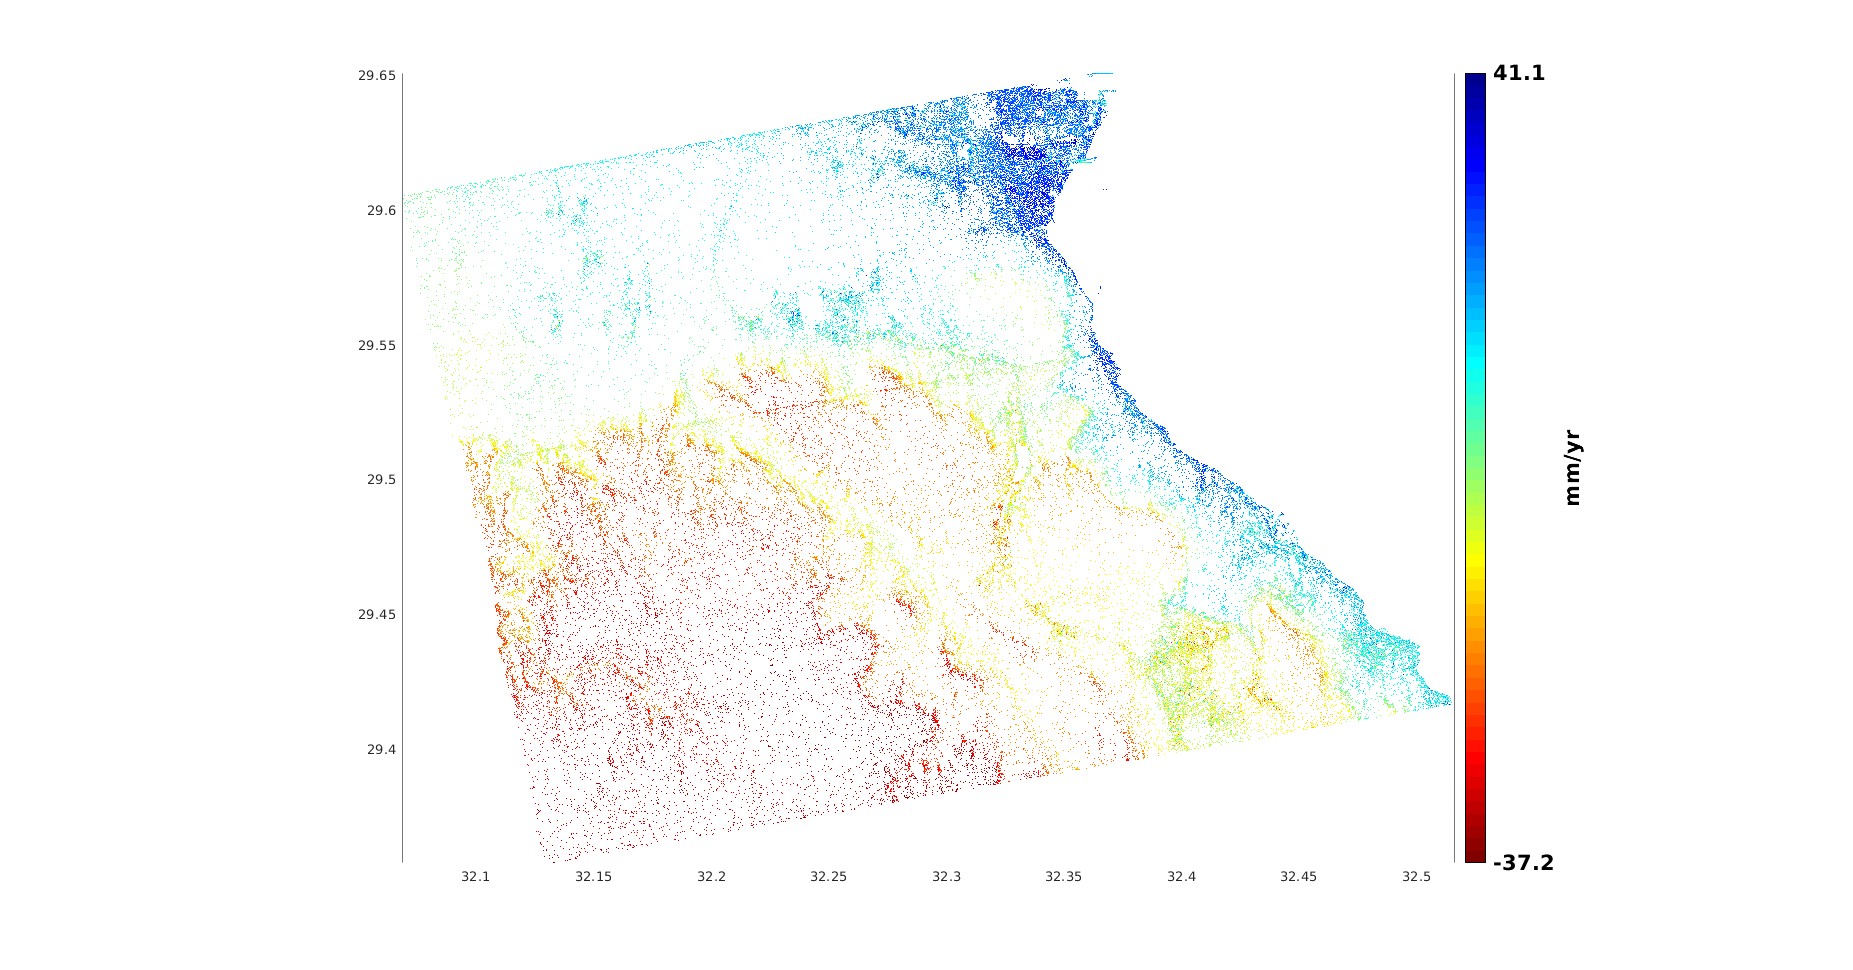
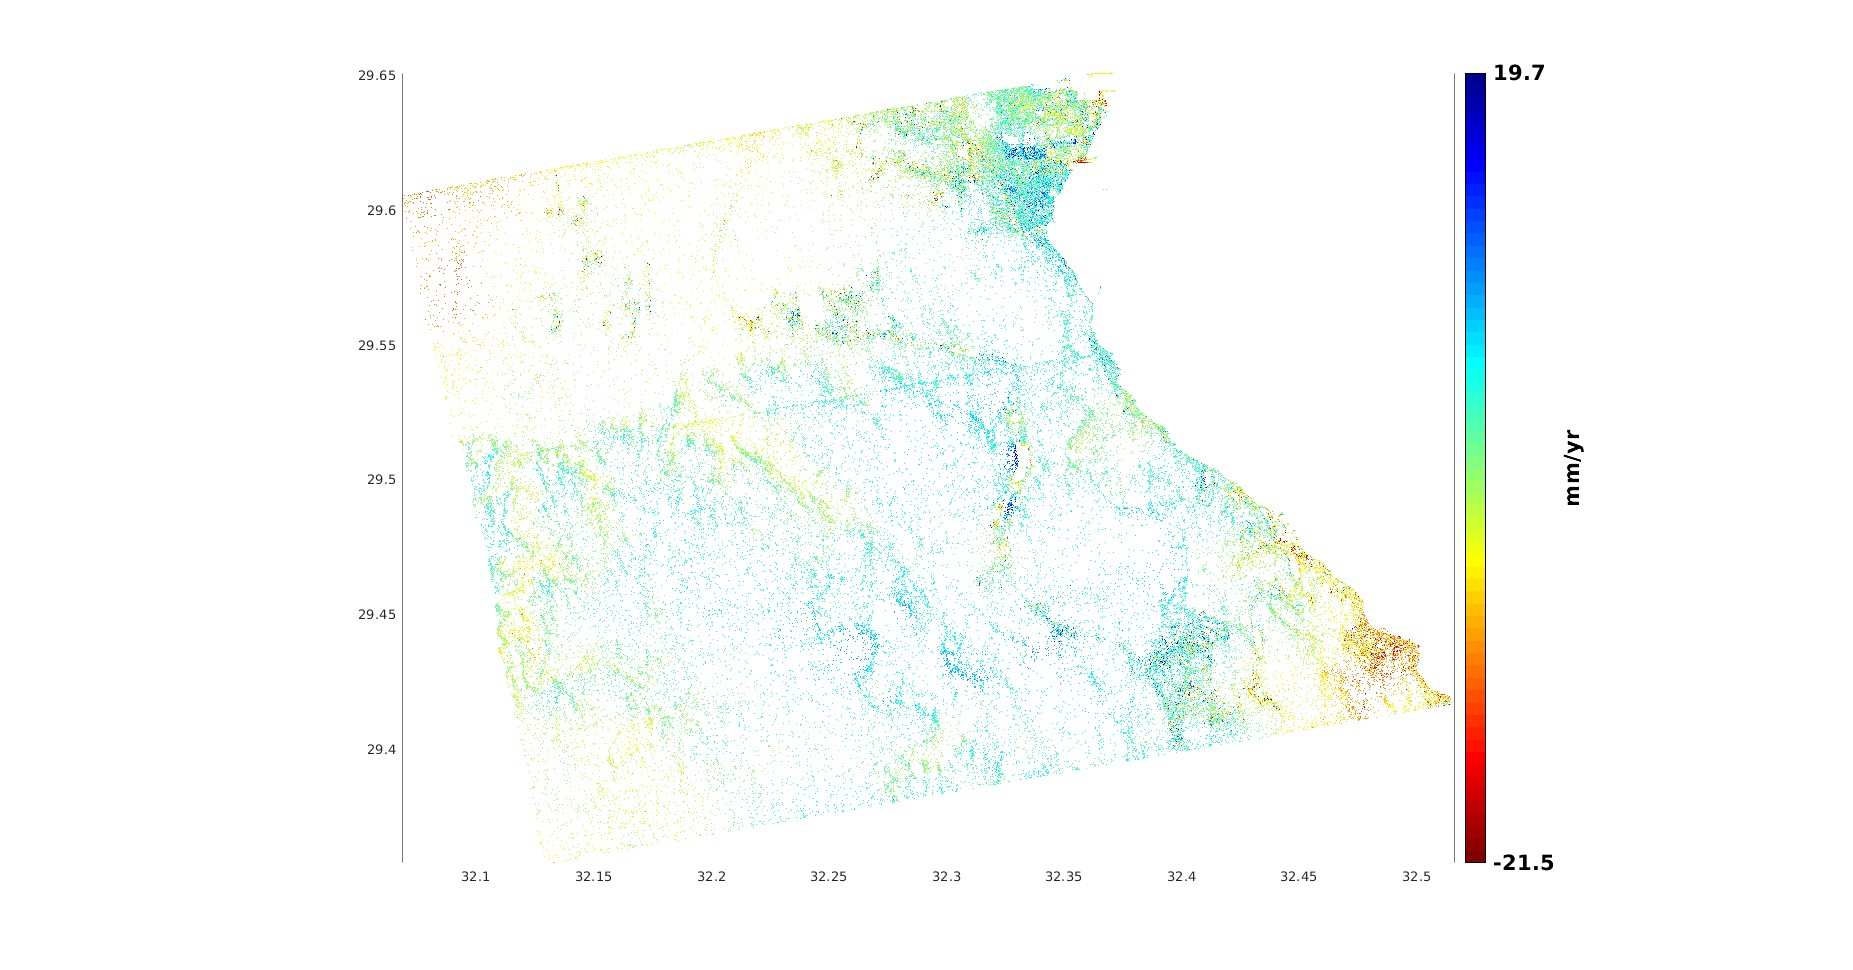
I can see that the removal of tropospheric contribution using the most basic APS linear has changed the LOS relative velocity from large negative values into small positive values especially in the middle of the area near 29.5 to 29.45 lat and 32.2 to 32.35 long. But I am not sure whether the atmospheric correction was effective or did it introduce even more errors

I have not used StaMPS for several years either, but I understand that you used an option to estimate an atmospheric phase screen (APS) that is linearly proportional to elevation. This can work well if you are not looking to measure a geophysical signal that is also correlated with elevation. It looks like the APS linear correction was successful in removing the part of the InSAR phase that was correlated with elevation. You did not mention what kind of signal you are trying to measure, so we can’t advise on whether the APS linear correction might have introduced errors in your measurements.

I appreciate it. Thank you very much for your time.

I am not sure if I understand your question. I am looking forward to measure the small displacements in ground elevation caused by earthquakes which frequently occurred in the middle and eastern middle sections of this area to give clues about the locations of recently formed fractures and/or re-activated faults

I had the same problem too, my mean and absolute LOS velocity results indicates LOS uplift while the study area is tilted fault blocks of normal fault system (subsidence is expected). Maybe the atmospheric phase screen removal is erroneous because I have used TRAIN with oscar-client-python/get_modis.py script and the method used was the aps_linear which assumes constant tropospheric contribution in space and isn’t affected by relief variation . have you figured out a solution yet ?

Alright, I have found that the atmospheric removal using TRAIN’s Linear tropospheric correction was based on an old script. How may I configure APS_CONFIG.sh file to be used for automatically downloading updated estimates for atmopsheric delay. so far I can’t downlaod any data from EOSDIS

[typo corrected for the benefit of text searches] Do you have an EOSDIS login? Have you tried using NASA EarthData Recipes?

All data downloads from the NASA EOSDIS servers require a NASA EarthData login account. You can register for free at this website:

2 Likes

Should I request GACOS’s ztd maps in binary grid format instead of Geotiff format so that they can be implemented into matlab together with the unwrapped phase?

I am having problems on how to apply the GACOS atmospheric correction with StaMPS. The unwrapped interferograms are produced in formats only readable by matlab and they only contain PS pixels and not exactly “Raw Interferograms” as what (Yu, C., Li, Z., & Penna, N. T. (2020)) have described in their model. So if there’s a tutorial that can guide into step by step for such a purpose, would be an outstanding initiative

Have you used the GACOS utility before? I have downloaded the ztd maps in binary grid format for each date of the sentinel 1 acquisitions and have downloaded the matlab codes to use them but I still can’t figure out how to apply them

1 Like

Maybe because of aps_config.sh that is dependent on get_modis.py script.
See this Tropospheric correction for PSInSAR time series - Earthdata Forum

@ABraun :thanks for your patient answer until now ,could you tell me how can I know stamps(8,8) running correctly


Screenshot from 2023-04-02 19-48-17
It seems correct about step 8!,but when I run ps_plot(‘v-dao’),failed


image

I haven’t used TRAIN with StaMPS so far, sorry. Some general remarks are given here.

How are you able to remove the Atmospheric Artifacts from the LOS displacement map? which software have you been using instead of TRAIN, if you wouldn’t mind sharing?

Hi everyone, I am gonna sharing my recent finding with TRAIN using GACOS data. I found command “Not enough GACOS data to compute interferometric delays…”, while I’ve been trying to download GACOS data. Regarding this command, please give me some idea so I can continue the process. Thank you

Hi, I met the same situation as yours, and now I have solved this question.
It is because when downloading the GACOS data it should be in binary grid output format instead of geotiff.
Hope it can help.