the patterns are already present before the unwrapping. So I don’t think subsetting will change the observed data.
Yes that’s true, but as I understood from @arnab still couldn’t recognize the displacement and the residual phases, that’s why I gave this suggestions.
alright, I understand.
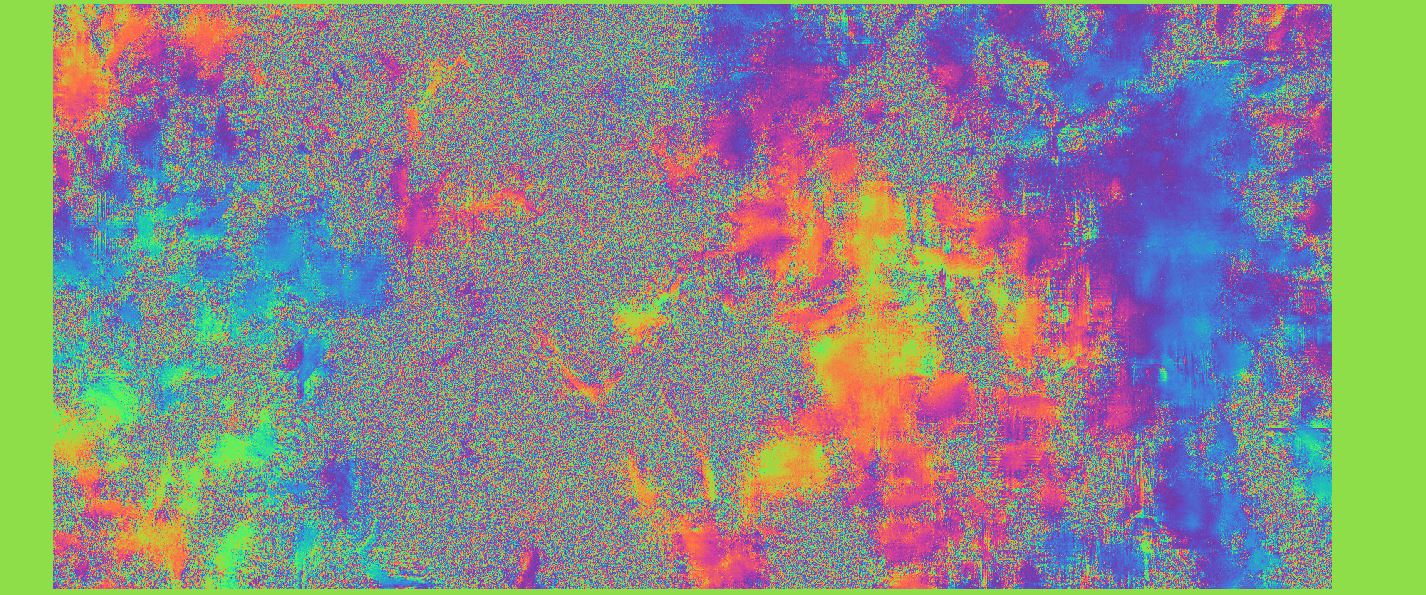
This is the wrapped differential interferogram I get and as @ABraun mentioned its the same pattern as was seen before the subsetting. I am yet to understand the point you are trying to explain @falahfakhri.
sorry, I didn’t see it before: flat-earth phase estimates the ellipsoid of the earth’s surface and how it impacts the phase in your area.
If you want to perform differential interferometry (DInSAR) for the mapping of displacement or subsidence, you need to check “subtract topographic phase” as well, because then all topographically induced patterns (as we might see here) will be reduced. Use SRTM 1Sec HGT AutoDownload.
This will leave you with an interferogram that only contains the phase difference between both aquisitions (and no longer the contribution of elevation changes).
small high coherent small area could represents more understandable phase pattern than the large area.
@ABraun @falahfakhri
This is the output without subtracting the topographic phase is as follows,
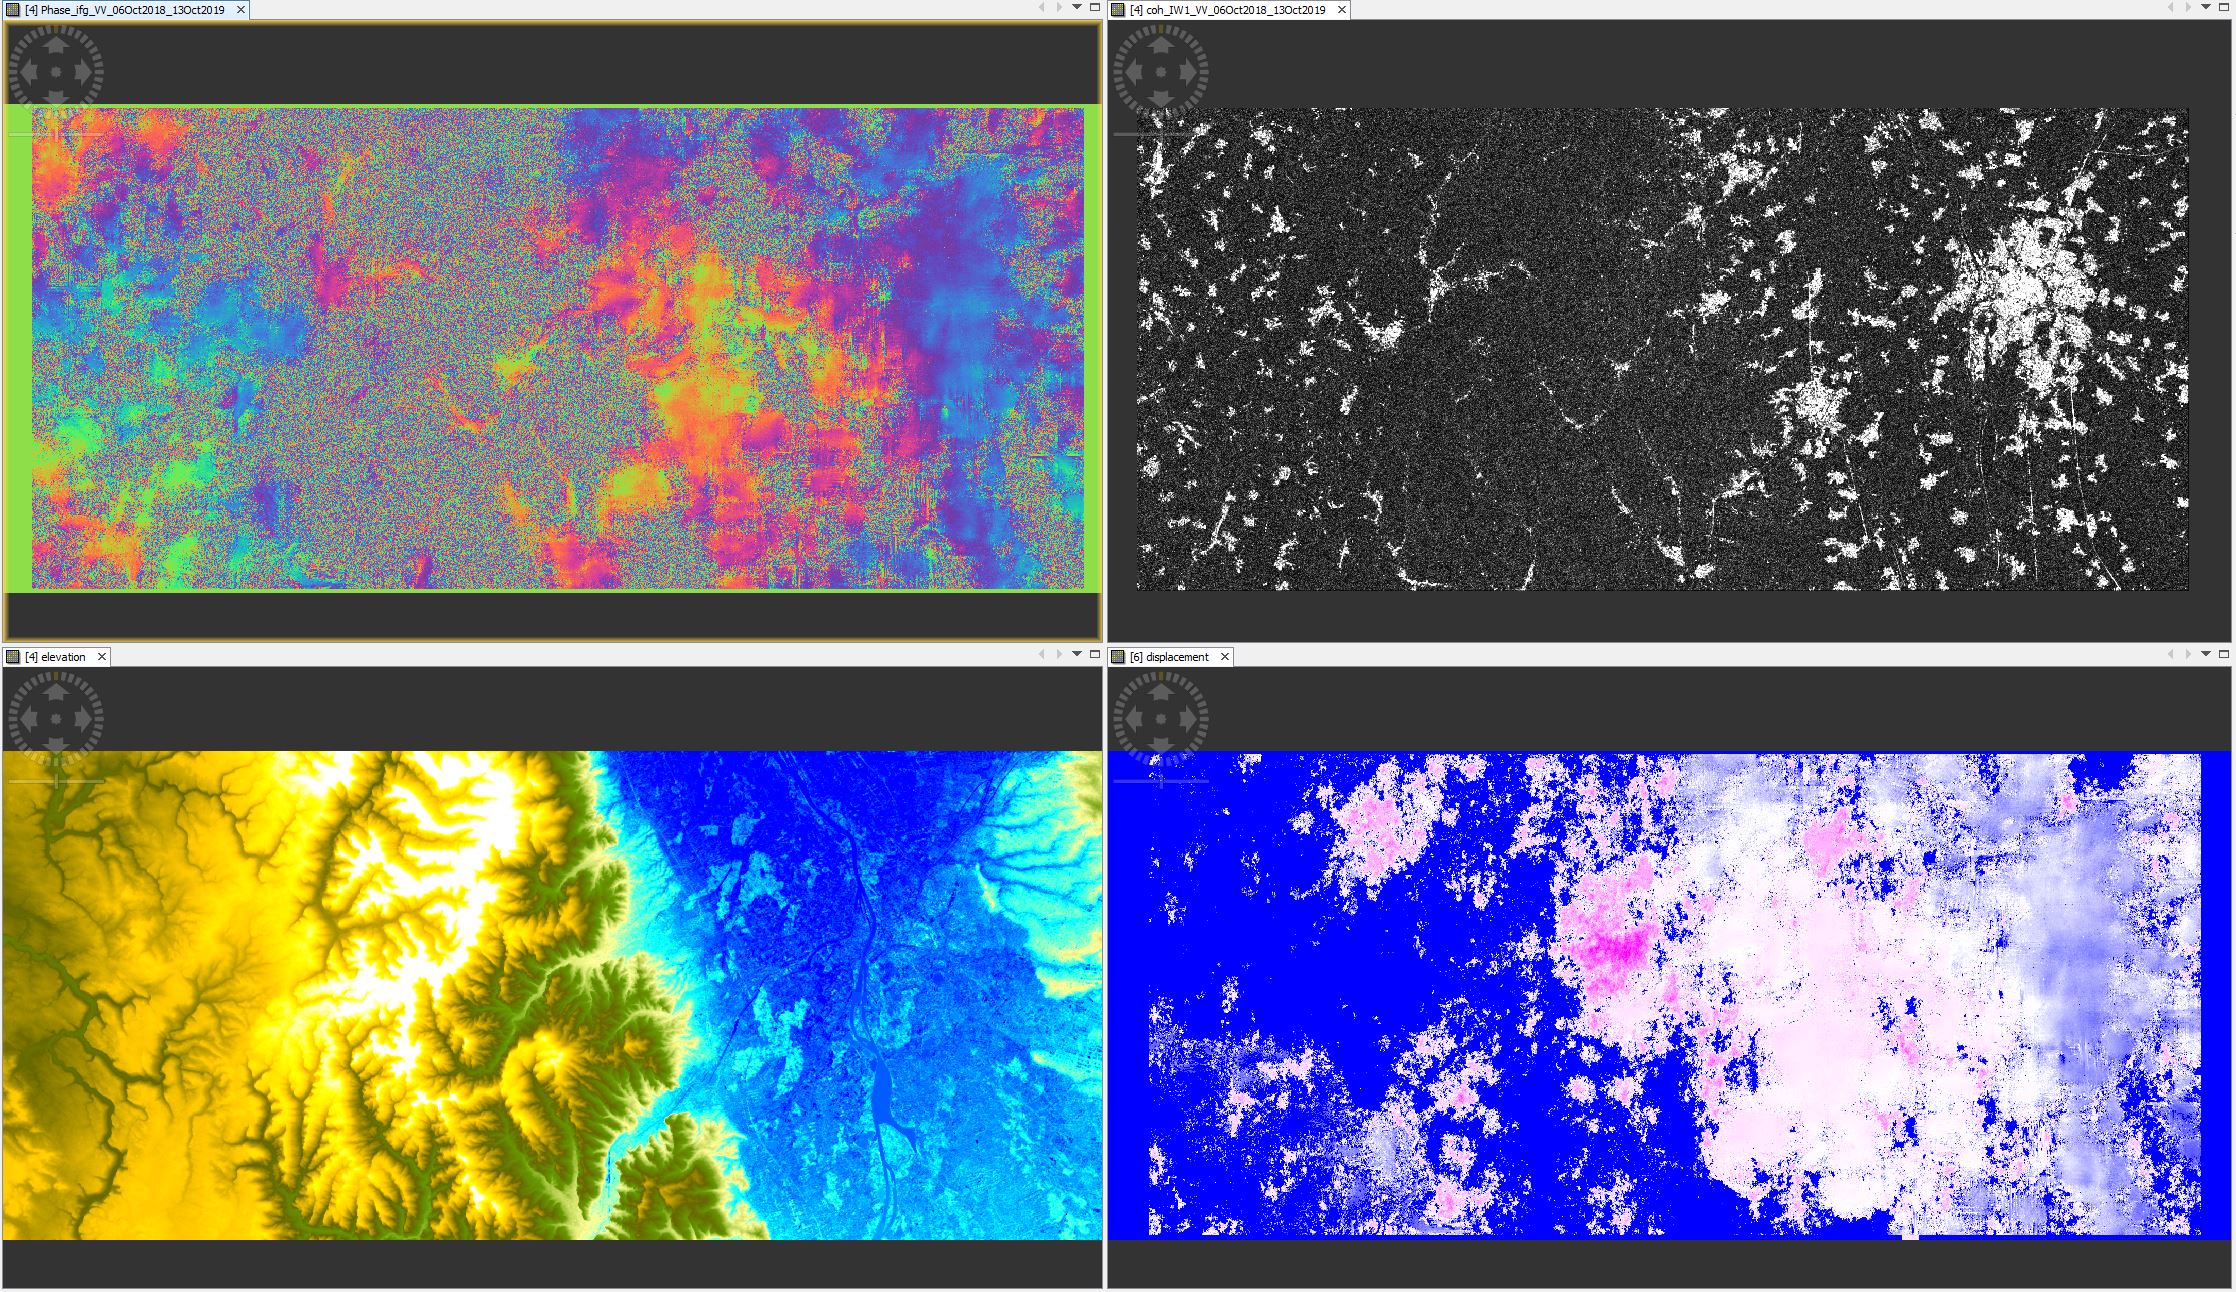
I am wondering if displacements of the order of 2-5 cm make sense with C-band which is the range of displacement I am getting (Blue areas as zero subsidence and pink areas with maximum of about 12 cm subsidence). And regarding checking the ‘subtract topographic phase’ tab, I also have a feeling that one needs to do it but why is there no mention of this in the video distributed by RUS?
Maybe the area in the tutorial is quite flat and hass little topographic contribution. The main advantage of subtracting the topographic phase is that the unwrapping is less prone to errors then. If there was no noise or other atmospheric factors, both with and without subtraction of the topographic phase, should lead to the same result.
Absolutely. It’s the land subsidence in Mexico City which is being talked about there.
But why is a subset needed, one can just zoom in right-
As other people mentioned, you can’t be sure with a single interferogram whether the fringes are due to displacement or variations in the atmosphere. The best way to distinguish real displacement from atmospheric effects is to look at multiple interferograms.
2 Likes
I will try out some InSAR pairs with single master multiple slave and report back here.
Can the atmospheric phase variation cause the illusion of unusually high LOS displacements in the resultant phase-to-displacement map, like 4 to 10 centimeters over very short time (less than 12 days)?
Yes, especially in the summer or near the equator, the tropospheric variations can cause phase changes equivalent to 10 or even 20 centimeters of LOS displacement in a short time interval.
If you wouldn’t mind, please take a look at this, maybe you can elaborate it better.
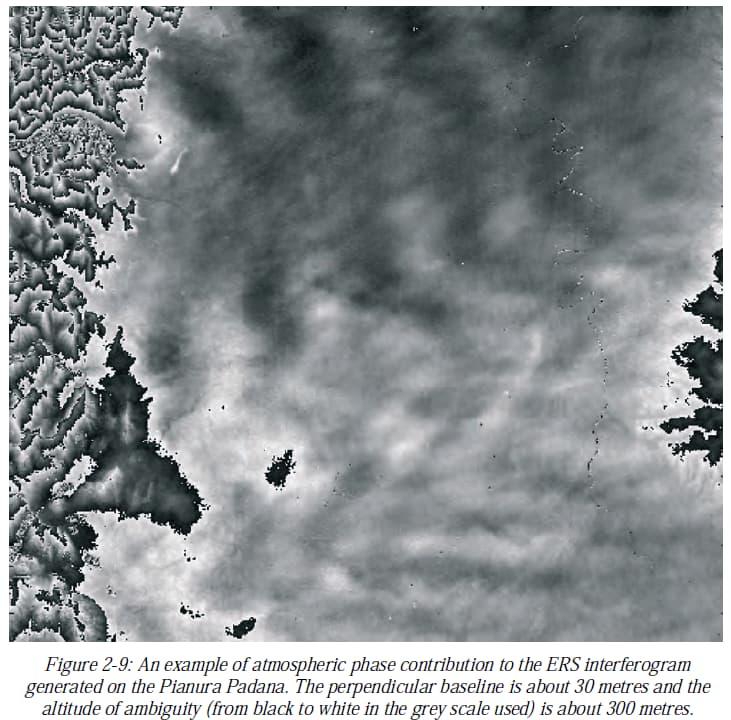
After (Ferretti et .al 2007a) InSAR principles-guidelines for SAR interferometry processing and interpretation, vol. 19, They said the atmospheric phase contribution is within 2pi peak-to-peak phase change
Does that mean the maximum interferometric phase change caused by atmospheric phase delay equal to 2pi, or did I understand this passage wrong ?
The tropospheric water vapor variations have a strong dependence on distance. In the Ferretti (2007) paper, he is talking primarily about the atmospheric effects at short distances that affect phase unwrapping. In most cases, the atmospheric effects are less than 2pi over the distances of a few pixels used in phase unwrapping, but the effects increase with distance, especially at distances of 10 km or more. It is worse if you have large topographic relief in your scene, as the water vapor varies with elevation in addition to the horizontal variations. It also depends greatly on the location. Land near very warm oceans such as the Persian Gulf or tropical oceans has much larger variations of water vapor than land at high latitudes where colder air cannot hold much water.
4 Likes
I understood from previous replies that the atmospheric effect is confusing to detect, but are there any clues, that most users agreed on, which indicates a high probability of atmospheric contribution ?
For example, Ferretti 2007 has showed this example
I have created an interferogram (the top image) for a desert area surrounding a gulf, and then it’s unwrapped interferogram (the middle image), and then created an LOS phase-to-displacement image (the bottom image). I noticed all share the same pattern showed inside the ellipse, which is similar to what Ferretti has mentioned, and also have noticed a displacement values up to 2.5 cm in a time period less than two weeks.
Does this say any thing about atmospheric delay-related phase?
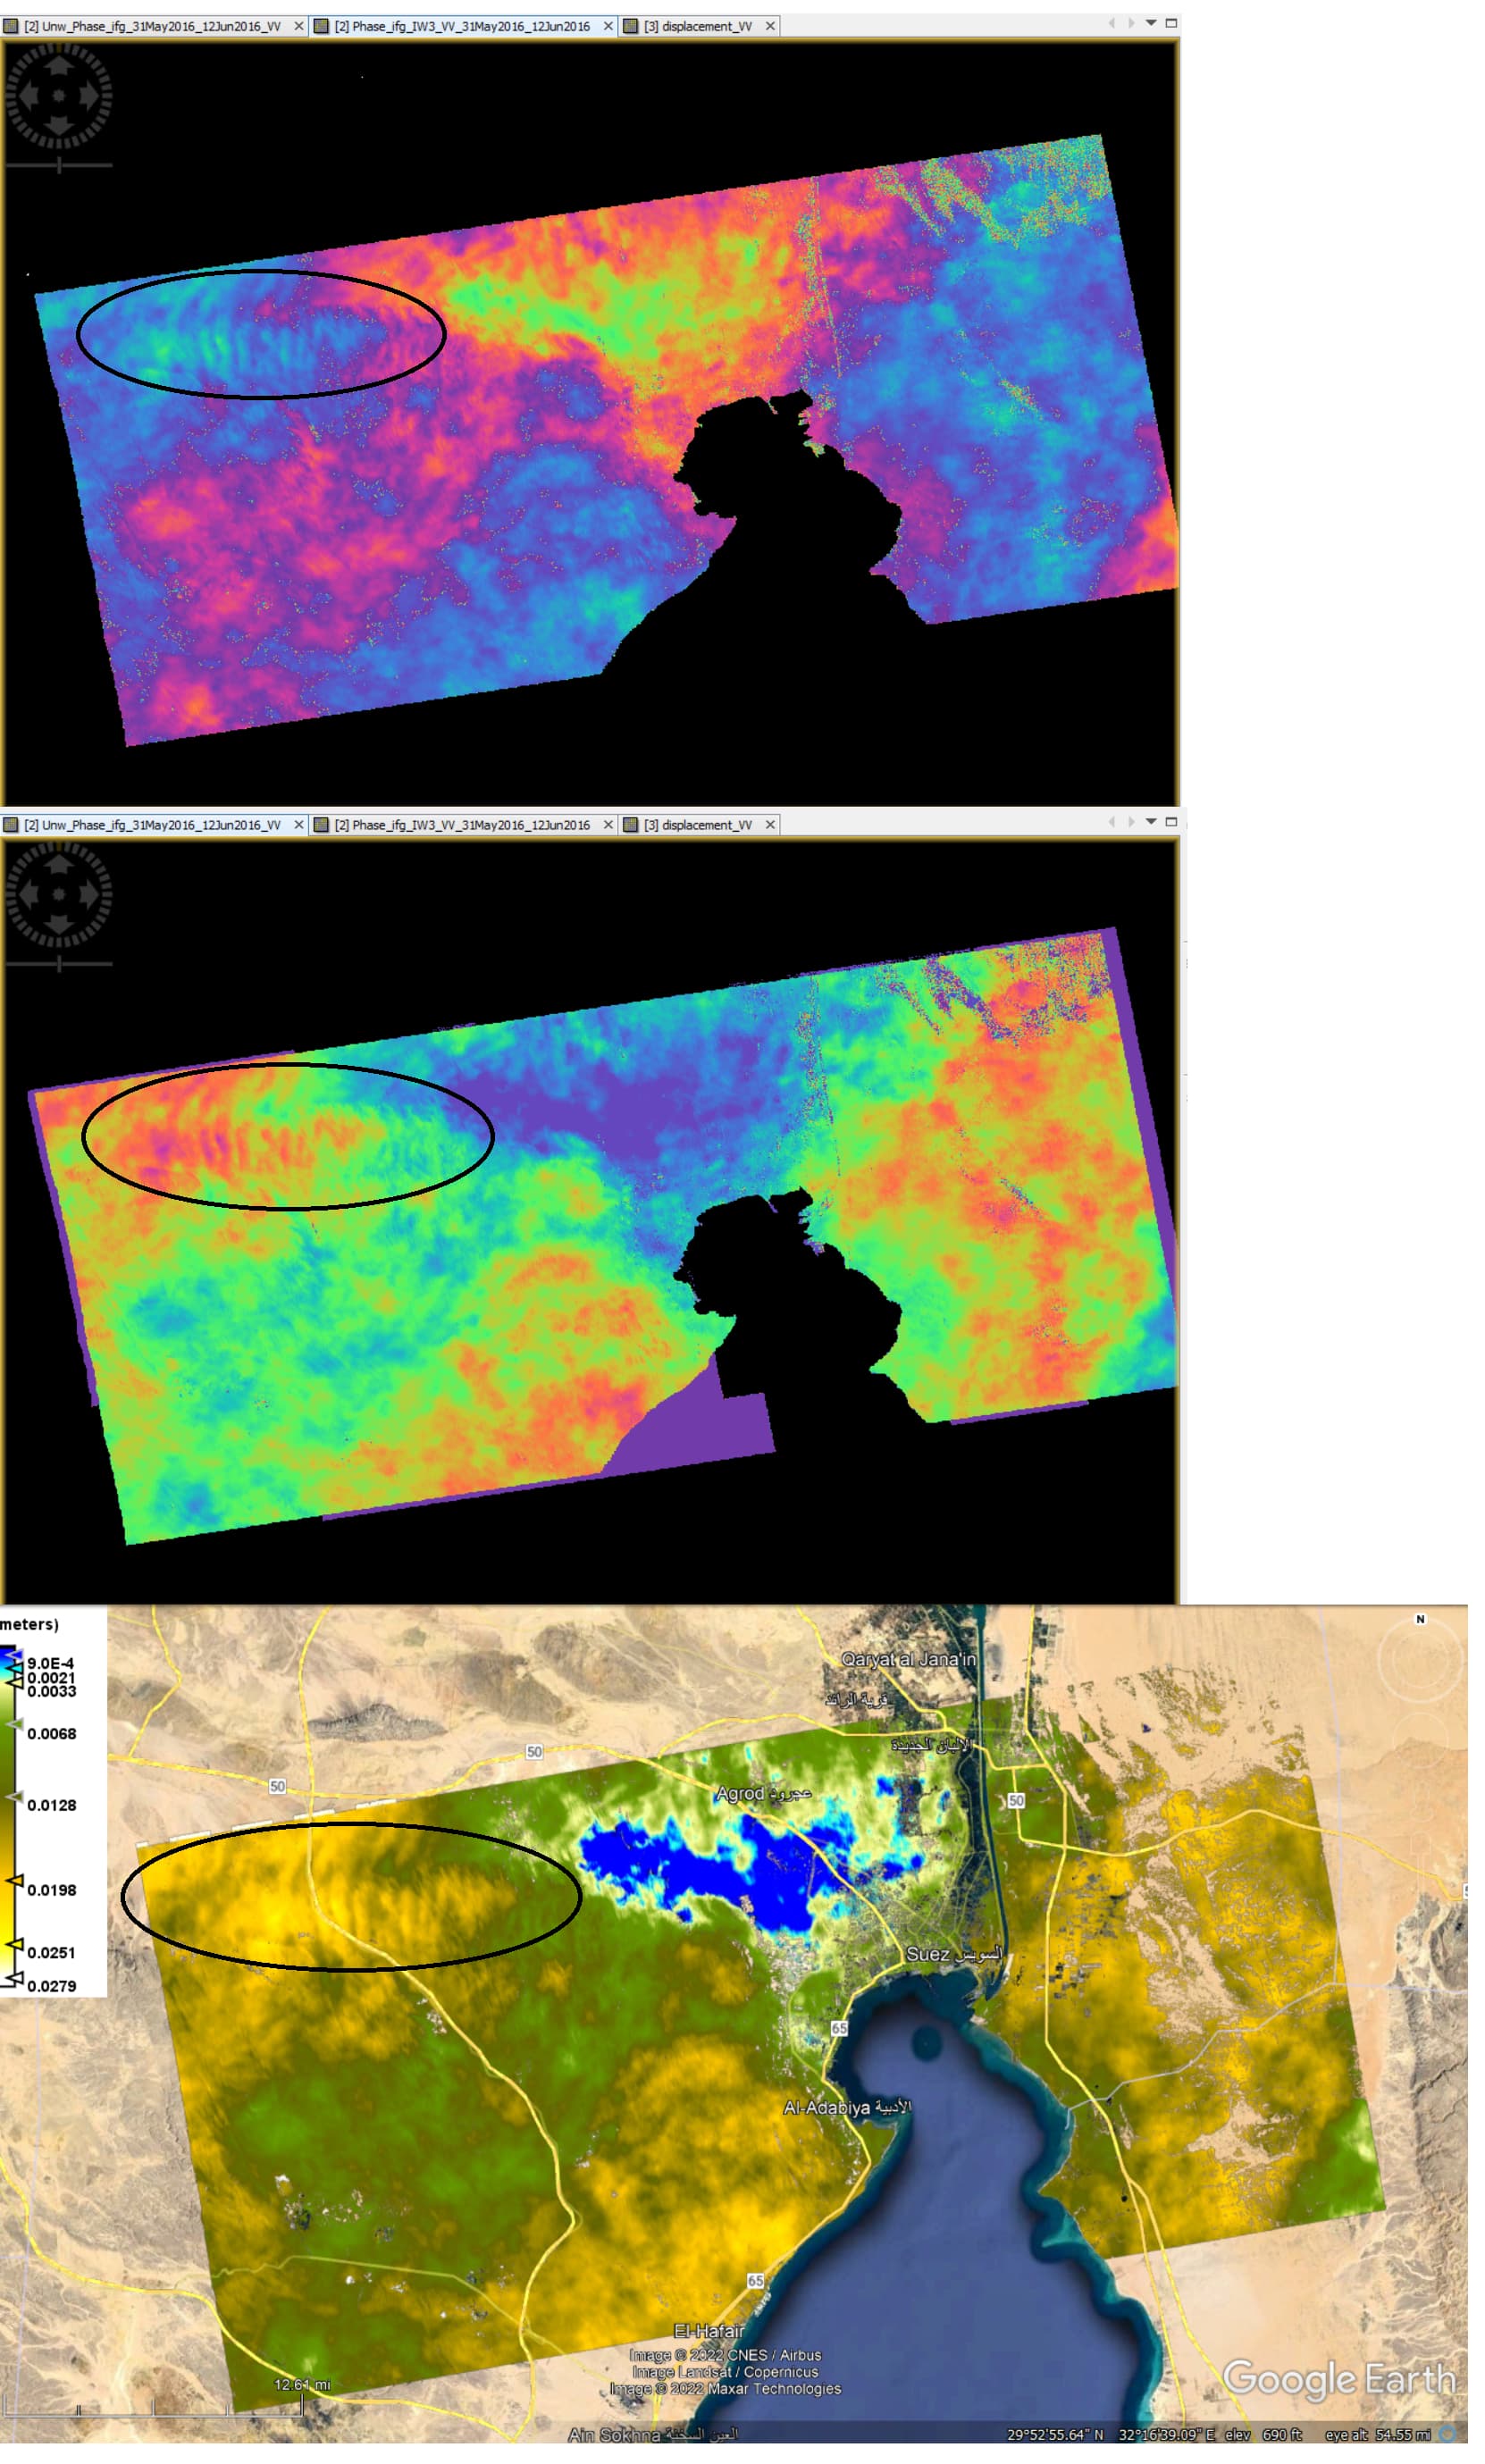
Lets say those data are from image pairs at 31-05-2016 / 12-06-2016,
should I create interferogram and displacement map from image pairs taken before and after this history to compare whether the same patterns persist ? (even if those ,before and after, image pairs don’t coincide with any earthquake event ?
Yes, when you can see that kind of wave pattern in the InSAR phase, it is almost certainly due to water vapor variations, usually these are gravity waves in the atmosphere caused by wind flowing over a topographic feature.
If you are looking for a coseismic surface displacement signal, you should try different pairs that cover the earthquake time and have different pre-quake and post-quake scenes. Features that are only in certain pairs are almost surely due to atmospheric effects.
The most accurate way to estimate coseismic displacements with InSAR is to process about 10 scenes before and after the earthquake and do a full time-series analysis to extract the step function due to the earthquake displacement. This paper has some description of how we did this for a magnitude 5.8 earthquake in Oklahoma, USA.
Surface Deformation of North‐Central Oklahoma Related to the 2016 Mw 5.8 Pawnee Earthquake from SAR Interferometry Time Series
https://doi.org/10.1785/0220170010
4 Likes
appreciate your time and providing this paper,
I have read about the potential causes of radar signal attenuation [from (EJFielding et. al 2017) (Goldstein 1995) (Rocca et. al 2000) (N. G. GERSON 1948) ] generated due water vapor variation in space and time, and sometimes the rainfall during the image acquisition and it seems like the changes of the refraction index of the atmospheric layers are what seems to be responsible for affecting the propagation velocities of the Radar pulses, but is the atmospheric layers sufficient to cause enough refraction to gradually change the incidence angle of the radiation?
Do you know a particular research that explains this atmospheric effect on the propagating wave fronts properly?
The variations of water vapor cause a phase delay that is the main effect on InSAR, the change to the incidence angle due to refraction is too small to see.