Batch procesing

hi there
i wonder of anyone could help.
i have 60 products that i would like to resample and clip. that’s the easy part…
i now want to calculate lets say NDVI (eventually i would like to have 14 indices) for each image and stack all those products into one multi layer image. the idea is to extract pixel value using a point shp file thereby having a temporal list of values of the index.
i can see how i can batch process a single product and calculate whatever i want but i don’t see an option of collating all products into a single file…
any advice?

thanks in advance

You could after stacking or collocation, Use pins to export pixel values, Source of the post

It’s possible to add up the ProductRead instead of Read in order to add up all your granules.

1 Like

hi falahfakhri
many thanks for your suggestions.
the link (and video) are clearly explained but what i was hoping for is a tool where i can import 64 sites from a shp file and import those as pins - to later export them as values. i didn’t see that option - am i wrong?

hi falah
so you mean use the productsetread where i can choose a bunch of products, make sure they are in temporal order and than write them up as a single image?
so to get there i need to:
bach process all my images - calculate an index - export each as a single band file
use productset-reader to load all those up - save it as one image
than (ideally) i would import a point shp layer - convert it into pin selector and export that table. i saw there was an import text file in the pin menu… ill play around and update here.
many thanks in the meantime

any other advice and tips - ill be delighted
tamir

As it is explained, it’s possible to export all the pixels values as text file, this text file could be converted to *.csv then it is possible to from File ----> Import ----> Generic Format—>CSV, " You can add Pins image. In the Pin Manager image you can configure the displayed data image and then you can export image it to text file."

Other option in case you like to work with python, is,

convert *.txt to *.csv

import csv

import itertools

with open(’.txt’, ‘r’) as in_file:
stripped = (line.strip() for line in in_file)
lines = (line.split(",") for line in stripped if line)
with open(’
.csv’, ‘w’) as out_file:
writer = csv.writer(out_file)
writer.writerow((‘Pixels_Values’, ‘Time’))
writer.writerows(lines)

create plot of pixels values and time

from matplotlib import pyplot, dates
from csv import reader
from dateutil import parser

with open(’…/directory/*.csv’, ‘r’) as f:
data = list(reader(f))

pixels_values = [i[2] for i in data[1::]]
time = [parser.parse(i[19]) for i in data[1::]]
pyplot.title(‘Pixels_valuse changes over Time’)
pyplot.xlabel(‘Time/weeks’)
pyplot.ylabel(‘Pixels Values’)
pyplot.plot(pixels_values, time)
pyplot.show()

hi all
ok so i took the advice and i have replaced the read nodeid with the productsetread option. now the resamplingop doesn’t recognize the source product… see images
this is peculiar because it is set on a “by pixel resolution” option (10m). the “by reference band” doesn’t show any options on the dropdown menu…

any ideas anyone?

After subset, you should stack your tiles and then continue with your demand, the graph you showed up is not correct,

thanks - ill correct that when i can - although the error is related to resample nodeid so i don’t actually see any bands …

im trying now from fresh (see pic) but if you understand why when i do productset-reader it is not showing me any bands to choose from…

Be sure that you have the latest version of SNAP 7
Firstly, all your tiles should be added up in the product Explorer, then create your graph, once the graph panel is opened, right click on read operator and delete it same thing to the write operator. Now stat to add up the operators sequently and connect them. After that press the + sign to add up all your tiles. Please do this with the graph you did show up.

hi there
ok nothing works.
i followed your advice, added the images to the product explorer, cleared the read/write components. added new ones in sequence but the same error occurs…
i think ill try again the batch again… or python (i know very little but i have to find a solution for this problem…)


there must be a bug look at the last image i sent - the set reader just doesnt read the images

if i didn’t mention - operating system is linux debian - not sure it matters…

After resample operator the right one is stacking, or you should create many write operators according to your tiles number, in the same time the error of the “Mandatory source product” , should be solved as following suggestions.

Similar error “Mandatory source product” is solved in here,

Source of the post

And in here,

Source of the post

I hope it helps, please let me know if it works!

hi falah
yes i just had a look in the xml view and i can see that for some reason the re-sampling component is before the image upload…
is there a way to open the file in txt and reorder the operations?

Yes, you could use WordPad or notepad, to open and edit your *.xml and save,

Please, have a look at the following link,

Source: https://m.wikihow.com/View-XML-Files

yep
i wrote it all by hand and now its working…
next step is to try and run it as batch.

i tried manually editing and running the same code with productsetread and it didn’t work/ something in this command is not working…

because in the end i want to have all the products of the index to be generated as one image ill have to run batch creating a separate file for each index and than stack them later somehow…

if you have any suggestion for the file format to be used (its huge files im getting) it wil be great…

Would you please to share your last edited *.xml, file , and as you mentioned it works, if that possible, in order to check it up.

hi man
ok im sharing the latest file but its only work in progress and not really perfect because i still have to work out a way to collate all images into one so i can sample them temporally…
am now beginning to wonder what to do with clouds - is there a component in graphbuilder that allows me to clear all clouds of the entire image (ie before i re-sample/sub) or do i need to do band by band? (pain in the ass)… in the latter - i might just add a component to the index calculation…

the key aim and idea is to monitor fire recovery of nature reserves. i have a shp file with 64 sites (for those i will have botanical, arthropod and soil data) and once i have the indices (a layer per per date) i want to extract one pixel (or kernel or some dimension) per site and produce a chart showing the temporal change in values. after that i guess - play with statistics, classification etc…

anyhow - thanks so far for your help…

snap_sentinel_set_cubic_clip_indices_exports_edited2.xml (18.3 KB)

Please concentrate on issue, once it’s being solved, you could raise the other one, First of all you’re working with sentinel 2, and you have many different dates tiles, as you mentioned in here,

For free clouds image you need at very first step to apply Atmospheric Corrections (AC) using Sen2cor,
However for those are subjected to could cover, the only thing you should apply is idpex,

Please take a look at the following post,

Source of the post

I suggest to you also to take a look at the entire thread, it already includes the previous post of Idipex,

Source of the thread

Coming back to your xml file,

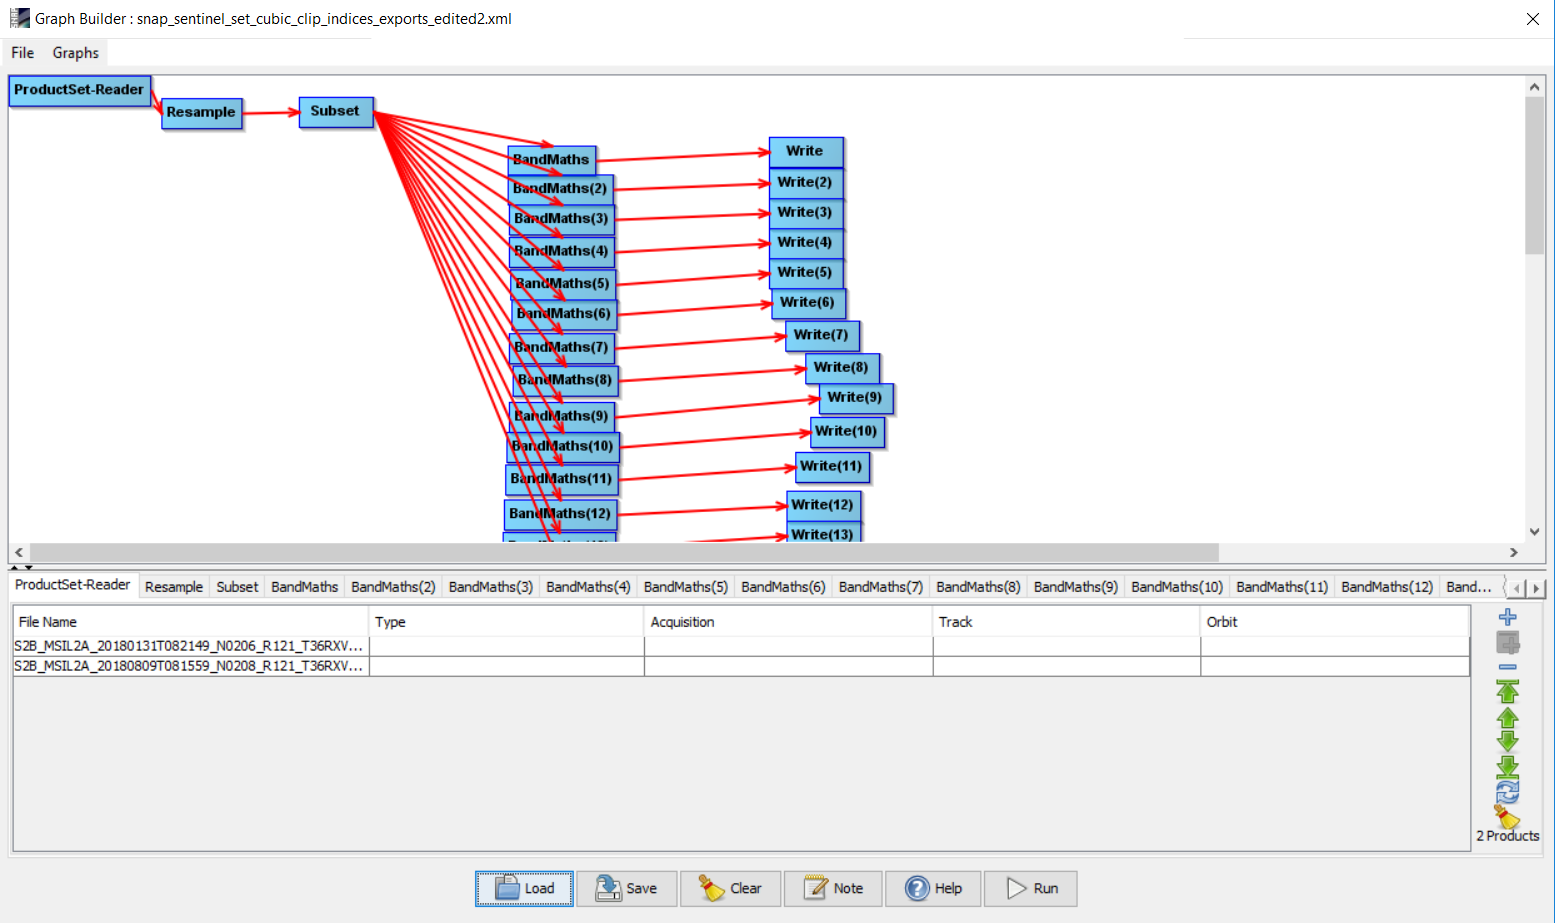
This should work as you said, after deleting the .1 and edited the PorductSetReader,

i tried - didn’t work… i don’t know why

But as you mentioned here it works, Now I’m out of idea sorry.