Classification Sentinel-1 problems with MaxVer

Hello!

I’m working with a sentinel-1 GRD image, with VH and VV polarization modes. I performed the preprocessing with the following steps:
Radiometric Calibration;
Speckle Filtering (Lee)
Terrain Correction.

From the resulting image, I performed the classification by the minimum distance and maximum likelihood classifier, with the same training samples.
However, the result for maximum likelihood generates noise in the “water” class, that does not exist in reality:
MD CLASSIFIER:

MaxVer CLASSIFIER:

I did the same thing for another image from another date, and the problem repeat:
MD CLASSIFIER:

MAXVER:

Radar data has a very imbalanced histogram (>95% of all values are smaller than 1, but the remaining 5 % can be impractically large). I would recommend to convert your data to log-scale: right-click > Linear to/from dB
This converts your data to a range between around -40 and +5 with a gaussian distribution of values which is much more suitable for MD or ML classifiers. Additionally, it increases the contrast between black water and bright land pixels.

Use the dB bands as an input for classification and compare if the noise in the result has decreased. If the contrasts are very good, you might even try an unsupervised classification with 2 output classes.

On the left you see the original calibrated data, on the right after conversion to dB scale:

You can clearly see the differences in the histogram: The threshold between dark water and bright land is more pronounced in the dB image.


Maximum Likelihood and Minimum Distance try to find thresholds in a multi-dimensional feature space. So if this feature space is imbalanced, as it is the case for SAR data, they might not work very well.

Besides that, a strong filter (maybe median 7x7) might also reduce the noise over water areas, especially if there are bright pixels because of rough surfaces or partially vegetated water areas.

2 Likes

Thank you!

The study I am doing is to identify aquatic vegetation in a reservoir. In the snap is it possible to extract the signature values from the polarizations to the interest classes? For example, water varies in the polarization VH between X1 and X2 while the aquatic vegetation varies in VH from Y1 to Y2. Already in the polarization VV (etc …)

One problem I always have in classifications made in SNAP is the value 0 assigned to certain classes:
image
This generates a null mask when I export the image to the QGis, for example. With no color, like a mask. How to change this? For example, set to “no date” the value 0, and for plants 1 and water -1?

Thank you!

As for the second question, you can disable 0 as NoData value in QGIS in the raster properties under Transparency

You can define conditional statements in the band maths, for example:
IF vv > 0.5 AND vh < 0.7 THEN 1 ELSE 2

396/5000

Sorry, I mean: I want to extract information from polarization signature about aquatic plants of the Sentinel-1 image. I dont know how this plants respond in polarization of Sentinel-1. I would like to find a threshold that differentiates the aquatic plant from the water. For this I would like to know if there is in the snap some tool that provides this information. For example: “the average of the polarization signature for plants in the Sentinel-1 image”. like in multiespectral images… We know the espectral assignature of vegetation, water, etc…

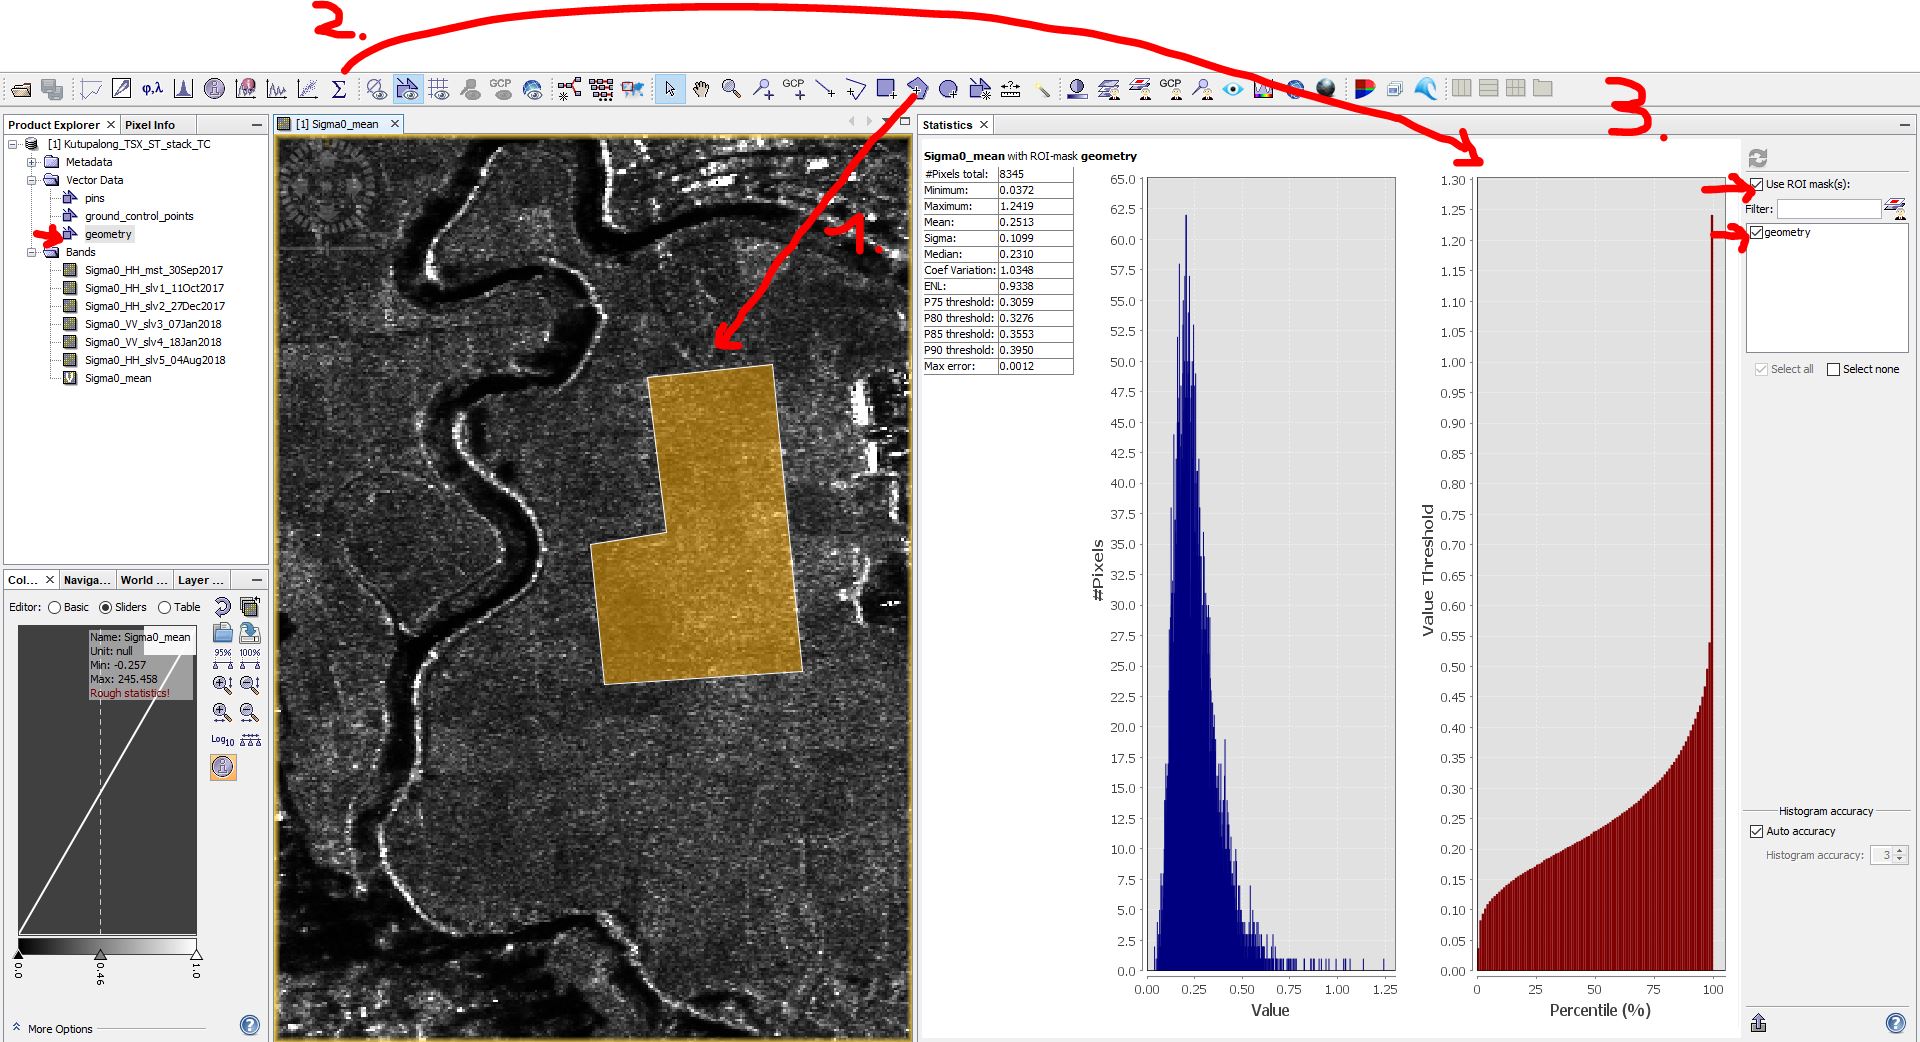
yes, sure. You can digitize a polygon with the tool in the toolbar and then select the statistics tool:

2 Likes