You can you the min/max values for an RGB profile. You need to find out which values work best for your time series. Start with standard and use these values then adapt them. This will give you consistent values.
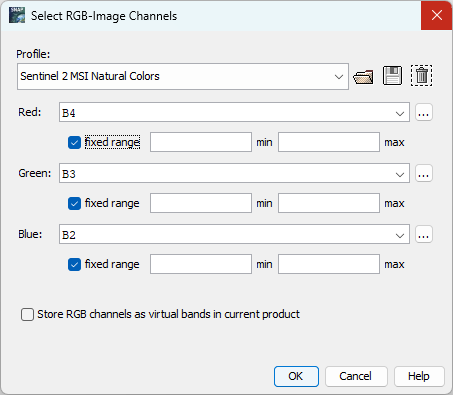
Good values to start with are
Red: 0 - 0.35
Green: 0 - 0.30
Blue: 0 - 0.25
I’ve posted them here:Colour anomalies in Sentinel 2A products - s2tbx - STEP Forum (esa.int)
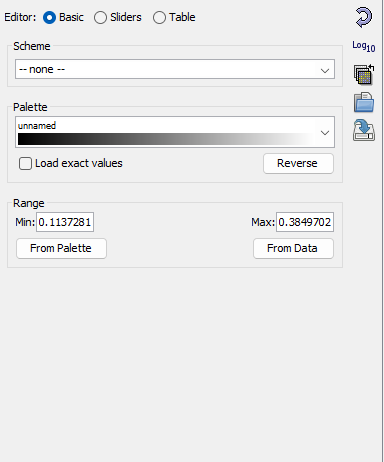
For grey-scale images you can define a palette and use the values from the palette not from the data.