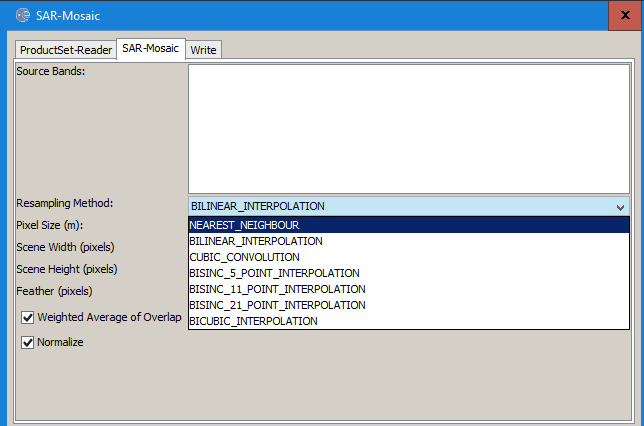
this is caused by resampling because both rasters need to be aligned to a common pixel spacing. Use Nearest Neighbor resampling instead of Bilinear if you want to maintain the original pixel values.
this is caused by resampling because both rasters need to be aligned to a common pixel spacing. Use Nearest Neighbor resampling instead of Bilinear if you want to maintain the original pixel values.
@ABraun Thank you it worked. Pixel values change by 0.1. .
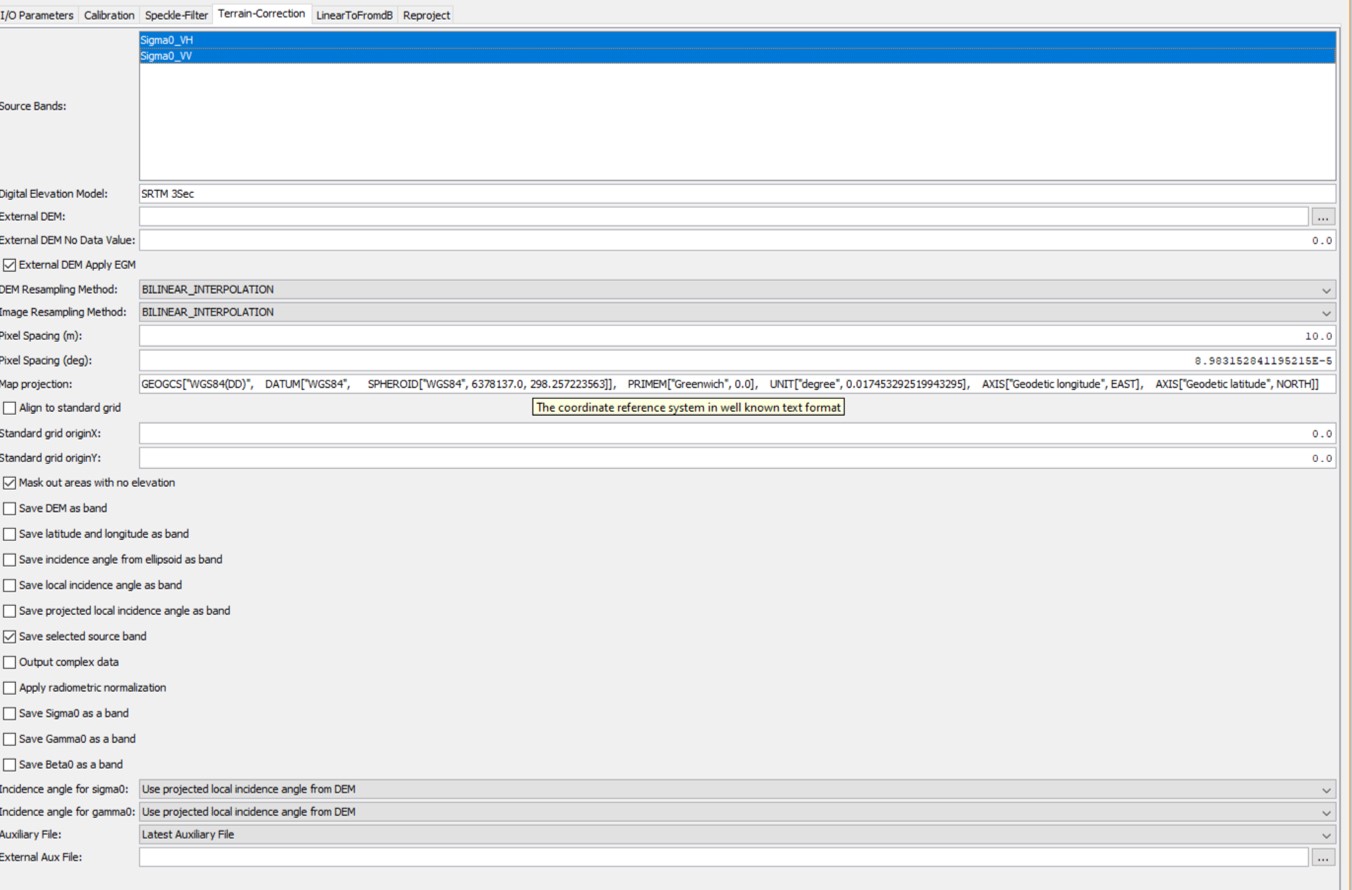
While doing Terrain- correction we are using Bilinear , does it make difference in the process?
and
Are we missing anything in the process which i mentioned earlier because when is see other posts i see Slice assembly and multi-looking is been used.
resampling always slightly changes the values, unless you select nearest neighbor.
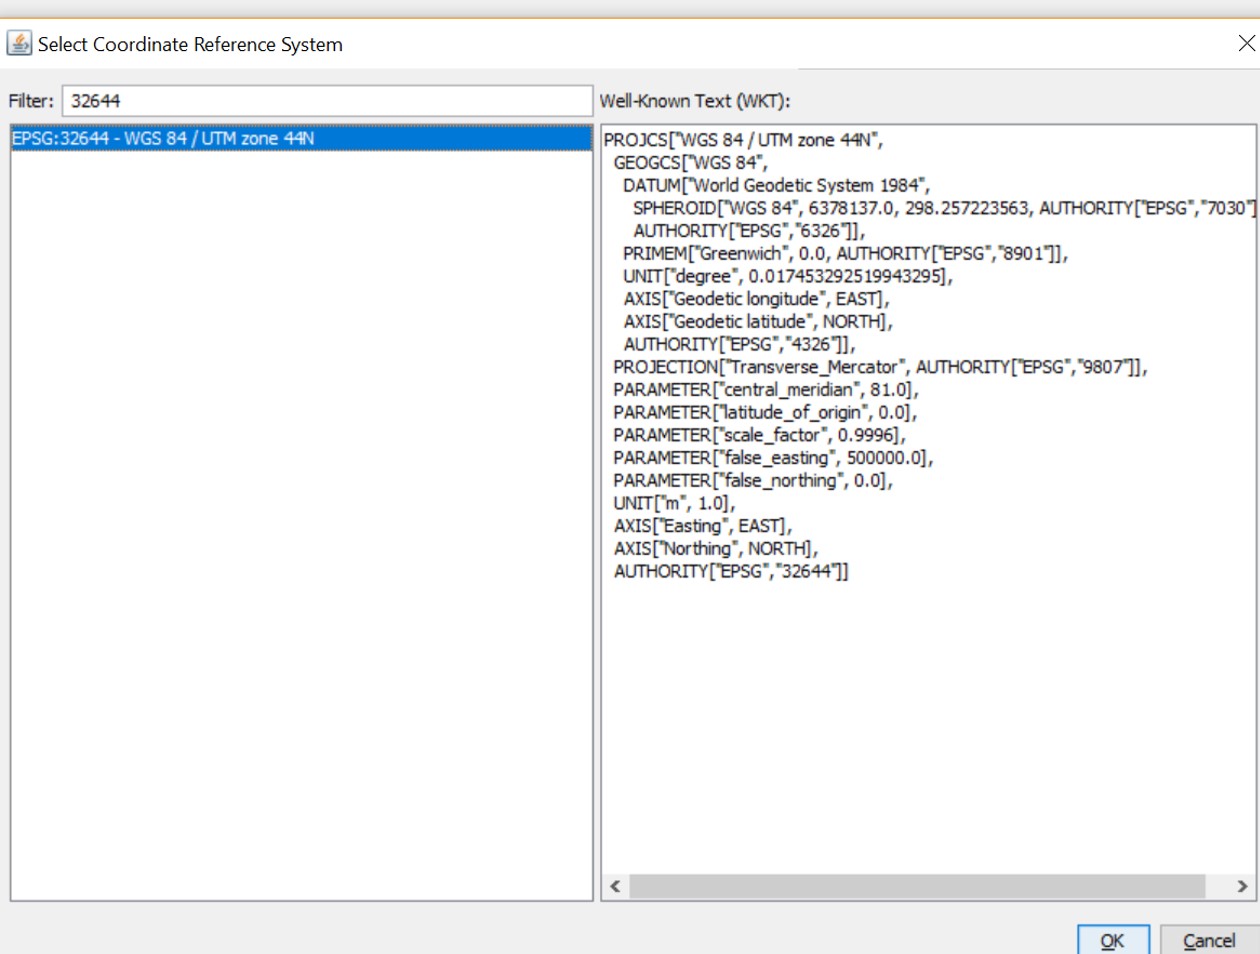
Your graph looks fine but I wonder why you reproject the image while you can define a coordinate reference system in the terrain correction step already.
In Terrain correction Default projection is maintained
In Re-projection we are using
Without re-projection I am not able to do zonal statistics. There is a projection difference.
it should actually work to select UTM 44N directly in the terrain correction step…
Ok Thank you will try that. Slice assembly and multi-looking is it required?
no. Your mosaicing replaces the slice assembly and multi-looking was already performed on GRD data.
Don’t just follow recipes, have a look at the single steps and test the effect of different tools whenever you are uncertain if need them or not  Only you know what product you need in the end and for which purpose.
Thank you. I saw product details. Its mentioned that these things are already taken care. But i wanted confirmation from experts so that I don’t miss any steps.
This analysis is for agriculture plots.
Thanks once again for help.
that is totally legit 
A new publication on rice production mapping based on Sentinel-1 data.
I have seen the all the links which you provided here,but I didn’t get any procedure to do the process sir please help me to do the process of agricultural monitoring and yield estimation using SENTINEL 1 DATA.
Thanks in advance.
I’m afraid, there is no step-by-step guide. The signatures of crops can be different, depending on the geographic area you are working in. Consequently, their identification relies on observations, field measurements, empirical findings, and the expected yield is a matter of growing conditions.
SNAP doesn’t have a tool which you simply run and retrive a correct map for any part of the world.
The procedure, however, is quite similar for many cases. Either classification, time-series analysis or regression of a dependent variable based on SAR backscatter. Please have a careful look at the suggestions in this post.
Once you developed an idea, feel free to ask for opinions. But for such complex topics, no ready-to-use algorithms exist.
Two further resources by the EO college:
https://eo-college.org/resources/agriculture/
https://eo-college.org/resources/agriculture_tutorial/
hi sir,
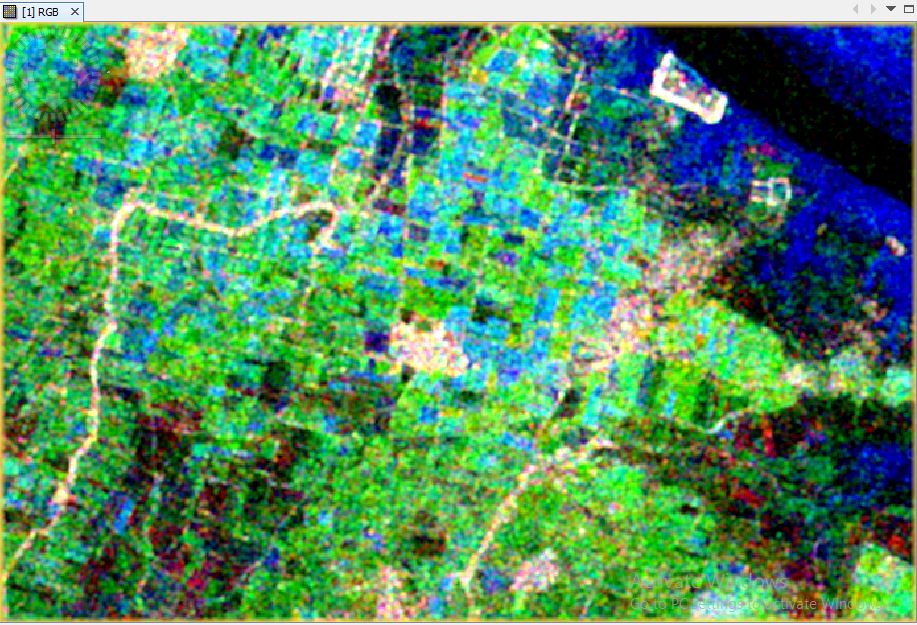
I have done the time series analysis for my study area and I got the back scattered signatures also, but the thing is sir I’m getting difficult to interpret the entire image. sir please help me how can we interpret the images and which based we have to interpret.
sir I got this image, how can i interpret this please help me sir.
many thanks in advance.
sir i have done the crop monitoring process and got the backscattered values after that I’m interested to add RVI (Radar vegetation index) also. Sir please help me in the process of radar vegetation index
Interesting article on the subject, with the latest crop monitoring methods. Developed by the EOS Crop Monitoring team. More information here
This is an advertisement but at least it is on topic. @AlexDoll Please do not spam once is enough.
Hello everyone
I recently started working with sentinel 1 data for the purpose of crop growth monitoring as my Ph.D research work. There is no slc image for my study area. Is it posssible to do close monitoring of crops using only grd data?
Thanks in advance.
SLC images are always available everywhere where GRD images are. They are both produced from the same data take.
Thank you @mengdahl for your reply.
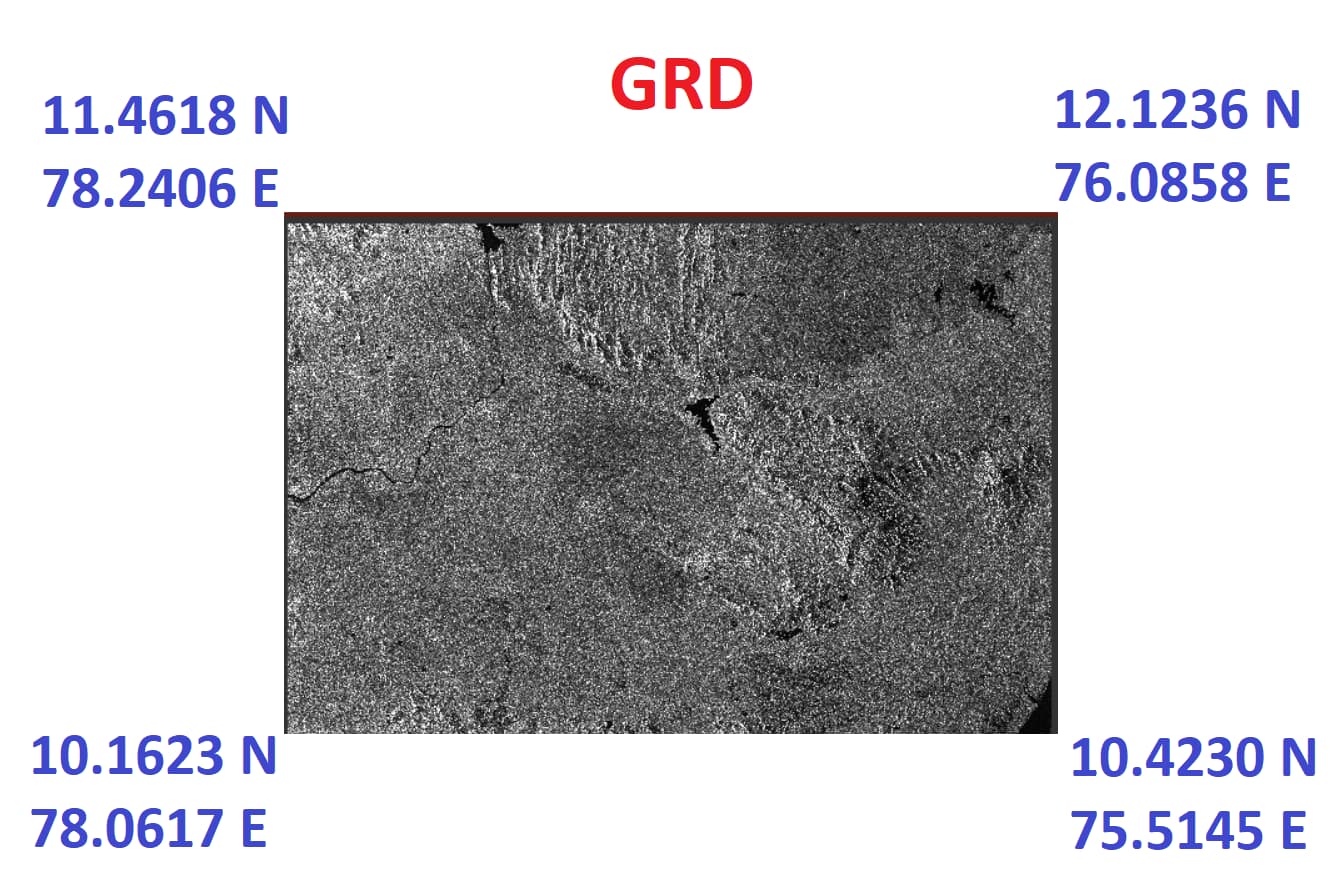
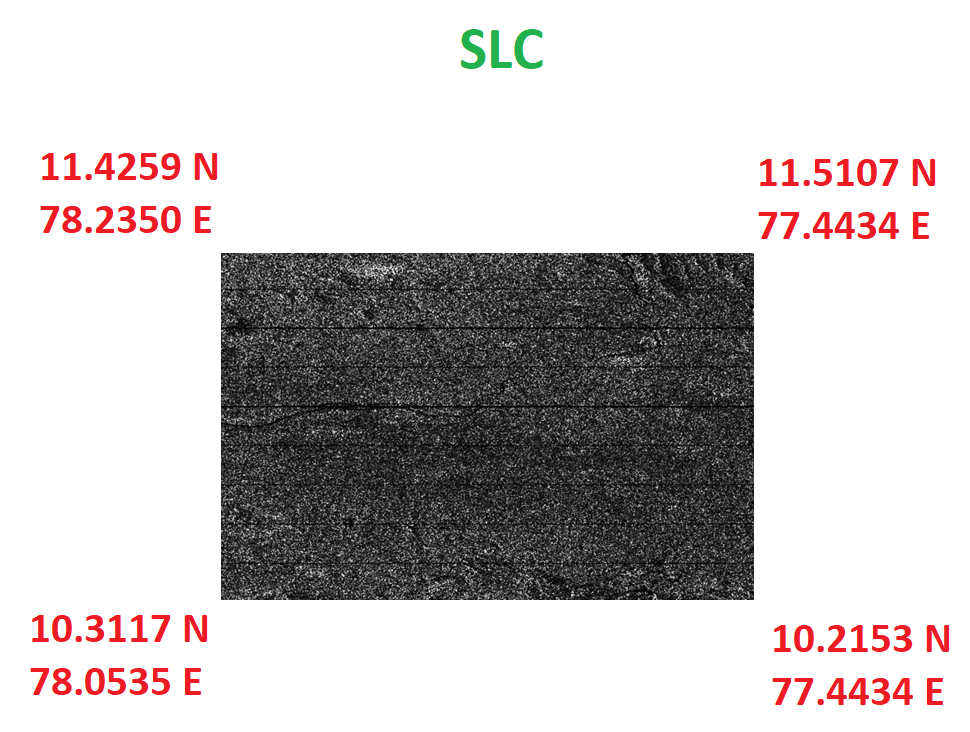
But I have download both grd and slc image for the same area on the same date. My area of interest lies in 76.93 E. But that area is available only in grd and not in slc. I have opened the image in Snap toolbox.
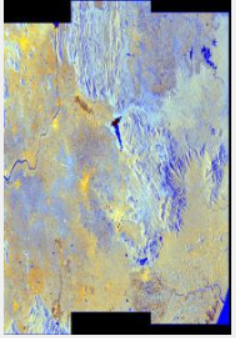
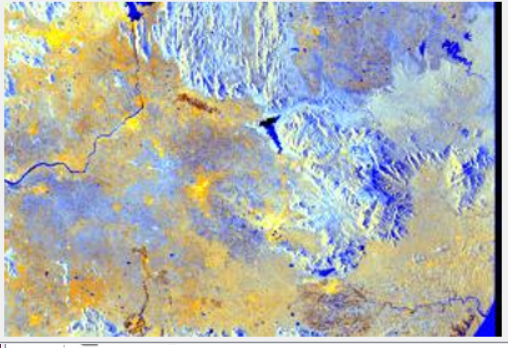
As you can see the slc image contains ony half of the area covered in grd. the image on the left is slc quicklook and the image on the right is grd quicklook.
Please, what should be done in this case for the slc image?
Thanks in advance.
The coverage of your quicklooks is almost exactly identical. SLC-data is delivered in slices so the burst that you are looking for can be found in the preceding/following slice.
Please study the SNAP/S1TBX tutorials, you’ll need to terrain correct both the GRD and the SLC in order to assess their geographical coverage.